WP108: Building Redundancy into a Data Center Cooling System
Introduction
Large data centers that must offer reliable, ongoing service cannot afford interruptions that result from the failure of one or more components. Redundancy is therefore built into the design in many ways. Power to the servers is backed up by banks of batteries (uninterruptable power supplies) that can operate until generators engage following a power outage. Copies of critical applications and data are stored on multiple servers, with one operating and one in reserve at any given time. A server can then be quickly replaced with its duplicate if equipment problems develop. CRAC failure, in the form of either the chillers or blowers on one of the units, can also lead to trouble if the total cooling capacity in the data center just barely meets the needs of the equipment load. Careful planning can ensure that any one of these single points of failure will not result in lost data or productivity in the case of any type of small-scale or large- scale event.
In this paper, CRAC failure is considered for a large data center. The data center is built with one more CRAC than is needed for the heat load in the room. This N+1 cooling scenario could operate with all CRACs on or, to conserve energy, with N CRACs on and one CRAC in standby mode. In either case, it is important to understand how the temperature distribution in the room changes when each of the units is shut down, either intentionally or unintentionally. The best way to do a comparison of this type is through the use of computational fluid dynamics (CFD).
Problem Description
To illustrate how such a comparison can be done, CoolSim software is used to model the flow field and temperature distribution in a 20,000 sq.ft. raised floor data center (Figure 1).
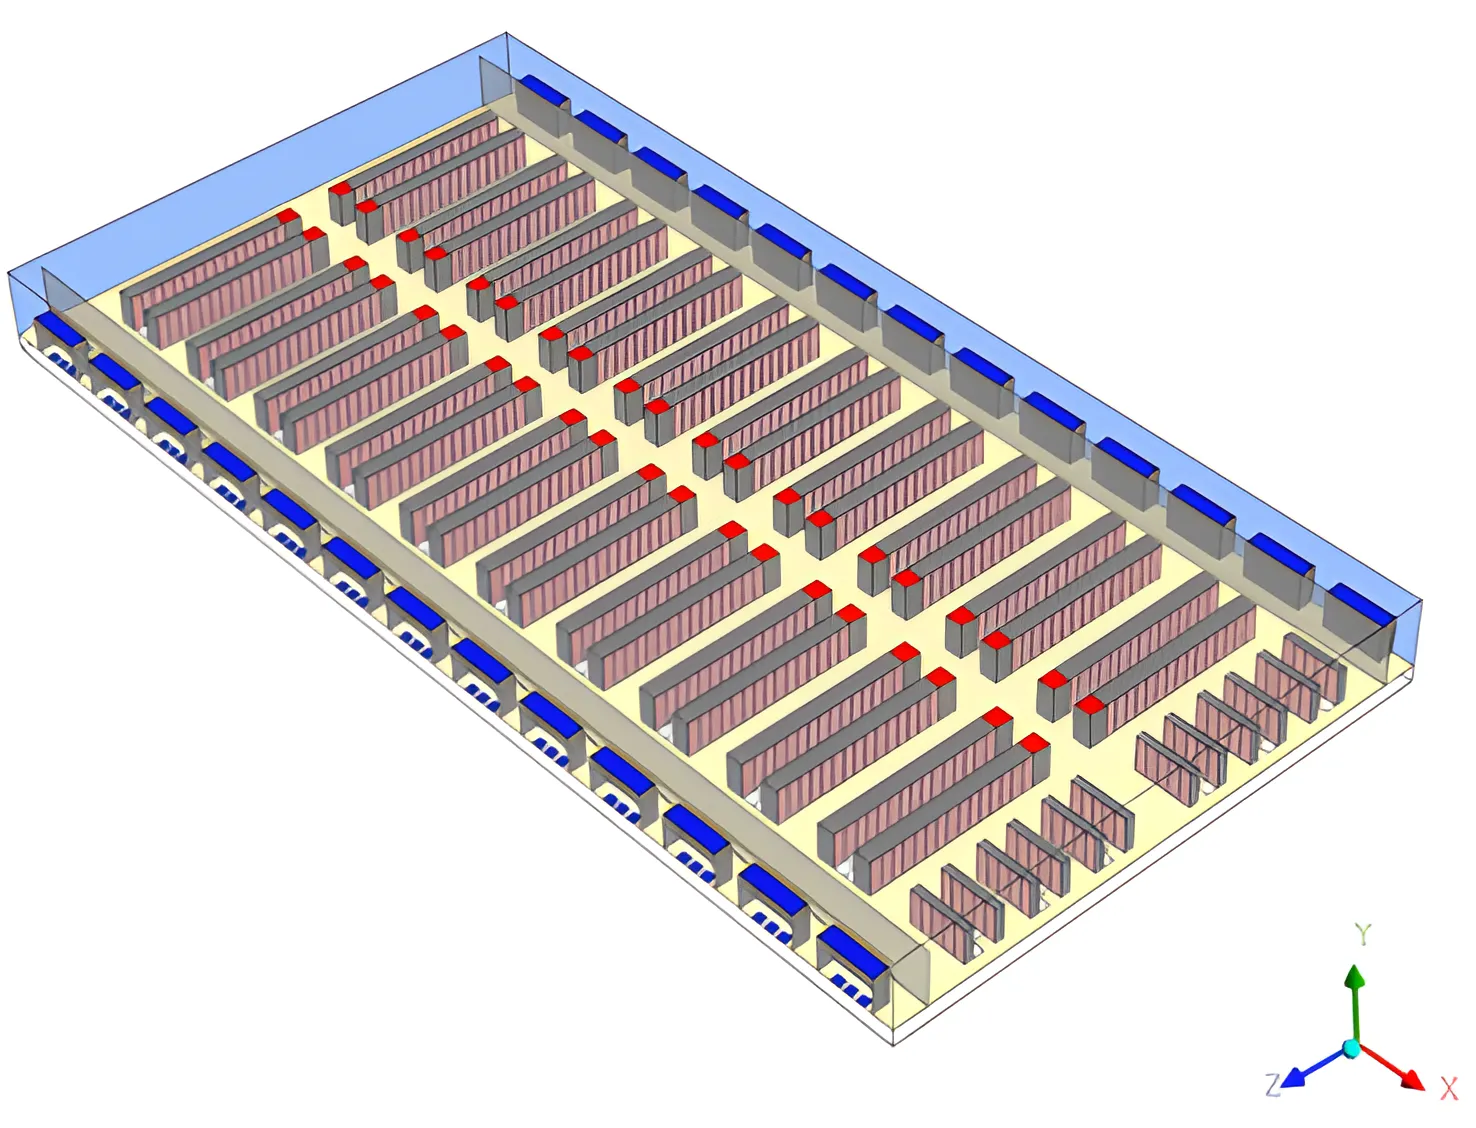
Figure 1
An isometric view of the data center showing the rack rows (pink), PDUs (red) and perimeter CRACs (blue)
The facility is 12 ft high with a 3 ft deep supply plenum. It contains 40 rack rows with 15 racks each. While most of the racks have a total heat load of 4 kW, four high density rows have racks with 8 kW each and six have racks with 3 kW each. In addition, there are 12 short rows of racks housing switches and other equipment with heat loads averaging no more than 1 kW per rack. PDUs emitting 1 kW each are positioned at the end of each rack row in the center aisle. The PDU heat loads combined with the rack heat loads, shown in Figure 2, have a total value of 2,635 kW.
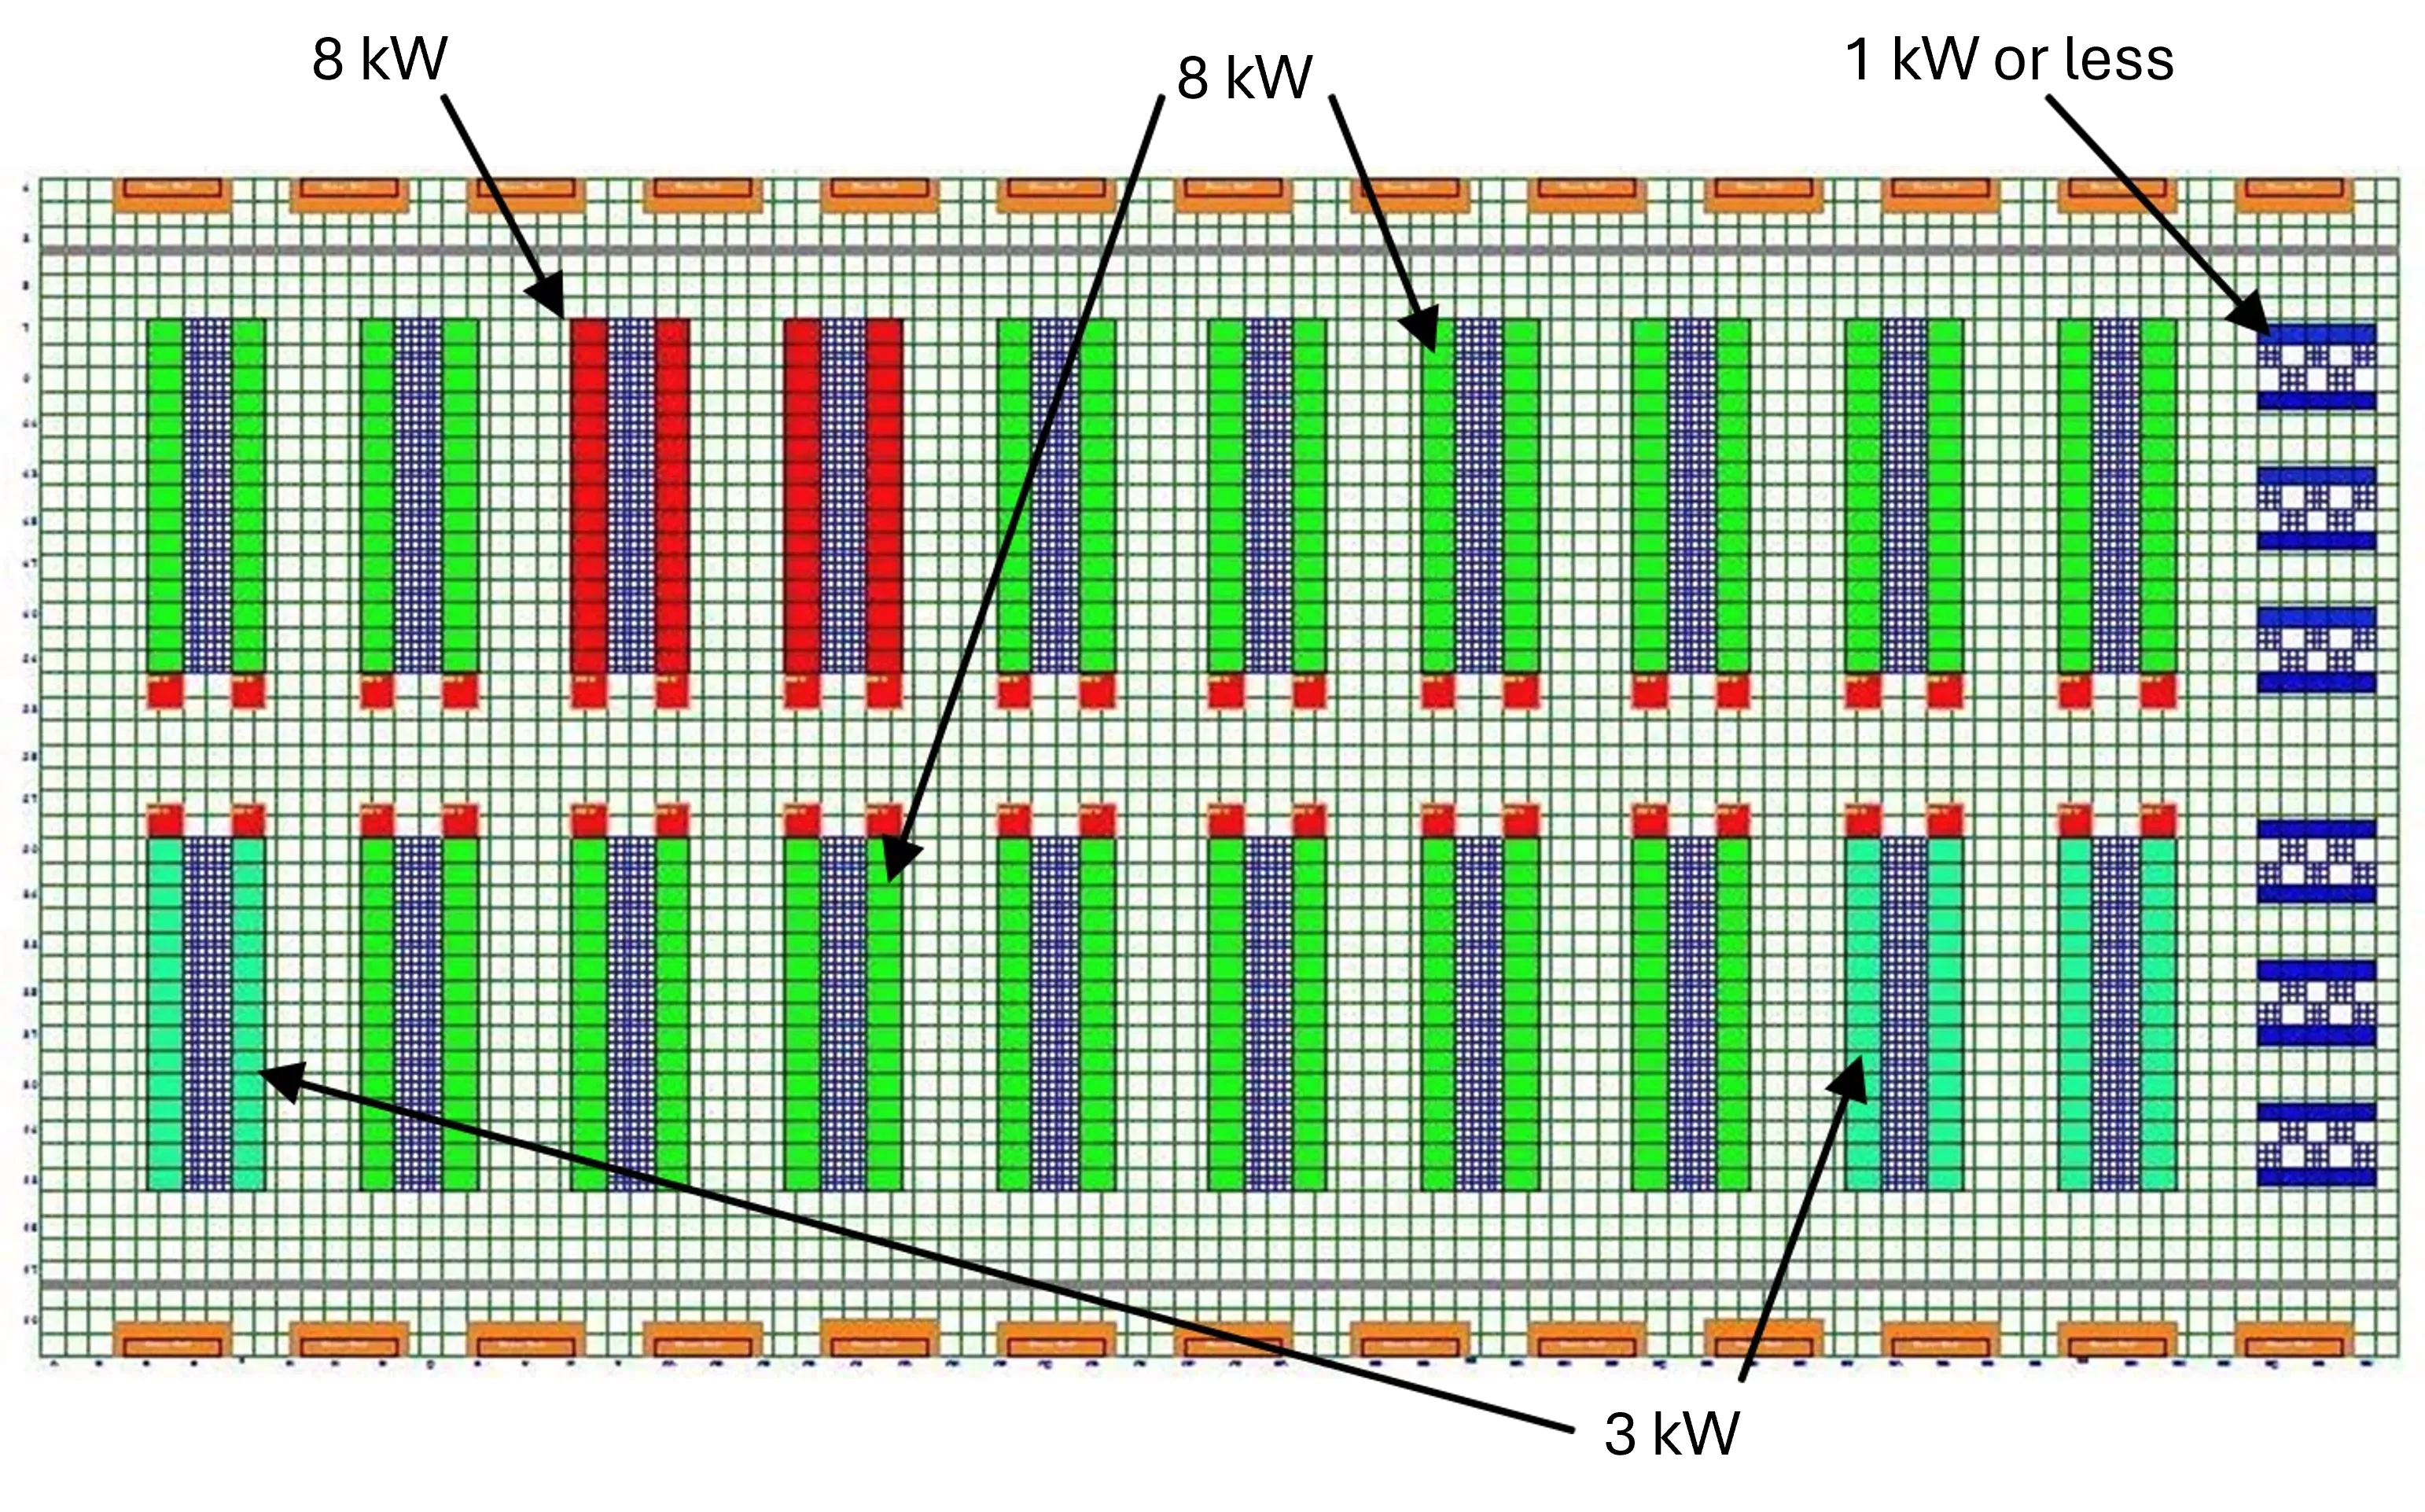
Figure 2
Rack heat loads range from udner 1 kW (dark blue) to 8 kW (red) with most of the remaining racks operating at 4 kW
Designing the Cooling Strategy
The data center is cooled using Liebert FH740 CRACs, which are positioned on opposite sides of the room behind walls that are 10 ft high. These units each generate 16,500 CFM of cooling air. The amount of cooling each does depends on the average return air temperature. The performance data shown in Table 1 lists the cooling capacity of the unit as a function of return temperature.
| Return Temperature (°F) | Cooling Capacity (kW) |
|---|---|
| 70 | 98.15 |
| 75 | 120.96 |
| 80 | 144.26 |
| 85 | 166.29 |
| 90 | 187.66 |
| 95 | 209.55 |
| 100 | 229.19 |
| 105 | 247.89 |
Table 1
Performance data for the Liebert FH740 CRAC
A thermostat temperature of 75°F is used for the simulation. This means that the supply temperature will be adjusted in an attempt to keep the return temperature as close to 75°F as possible, even if the heat removed is less that the value listed in the table.
The equipment in the room requires a combined air flow of 411,000 CFM for cooling. Using the flow rate associated with a single FH740, this means that a total of 25 CRACs are needed to meet the air flow need. The total equipment heat load in the room (2,635 kW) divided by 25 CRACs indicates that an average of 106 kW must be removed by each CRAC. Since the performance data indicates that each CRAC can remove 121 kW if the return temperature is 75°F, this means that 25 Liebert FH740 CRACs are enough to meet the cooling and flow demands of the equipment in the room using a 75°F thermostat setting.
In order to build some redundancy into the cooling system, 26 CRACs are used for the design instead of 25. The CRACs are positioned symmetrically along the perimeter on opposing sides. To run the data center in an energy-efficient mode, only 25 of the CRACs should operate at any given time, with one in standby mode in case of a problem. Several questions arise when considering such an arrangement. First, is running with 25 CRACs as good as running with 26 in terms of the temperature distributions on the rack inlets? Second, if 25 CRACs are enough, which ones can safely be turned off without causing hot spots on some of the rack inlets? More importantly, which one(s) cannot? Questions like these are best answered using CFD. Because there are so many variations possible, a CRAC failure analysis is done using CoolSim. With this type of analysis, one or more CRACs are disabled in separate trials, and the trials are run concurrently on separate nodes of the computing cluster at CoolSim’s Remote Simulation Facility (RSF). One trial is also done with all CRACs turned on. Comparisons between the results can be used to suggest whether or not a 25-CRAC operation might be feasible and if so, how it might be set up.
Results
Trial 0: All 26 CRACs On
The first case to consider is the one in which all of the CRACs in the data center are turned on. Contours of rack inlet temperature are shown in Figure 3 for this case.
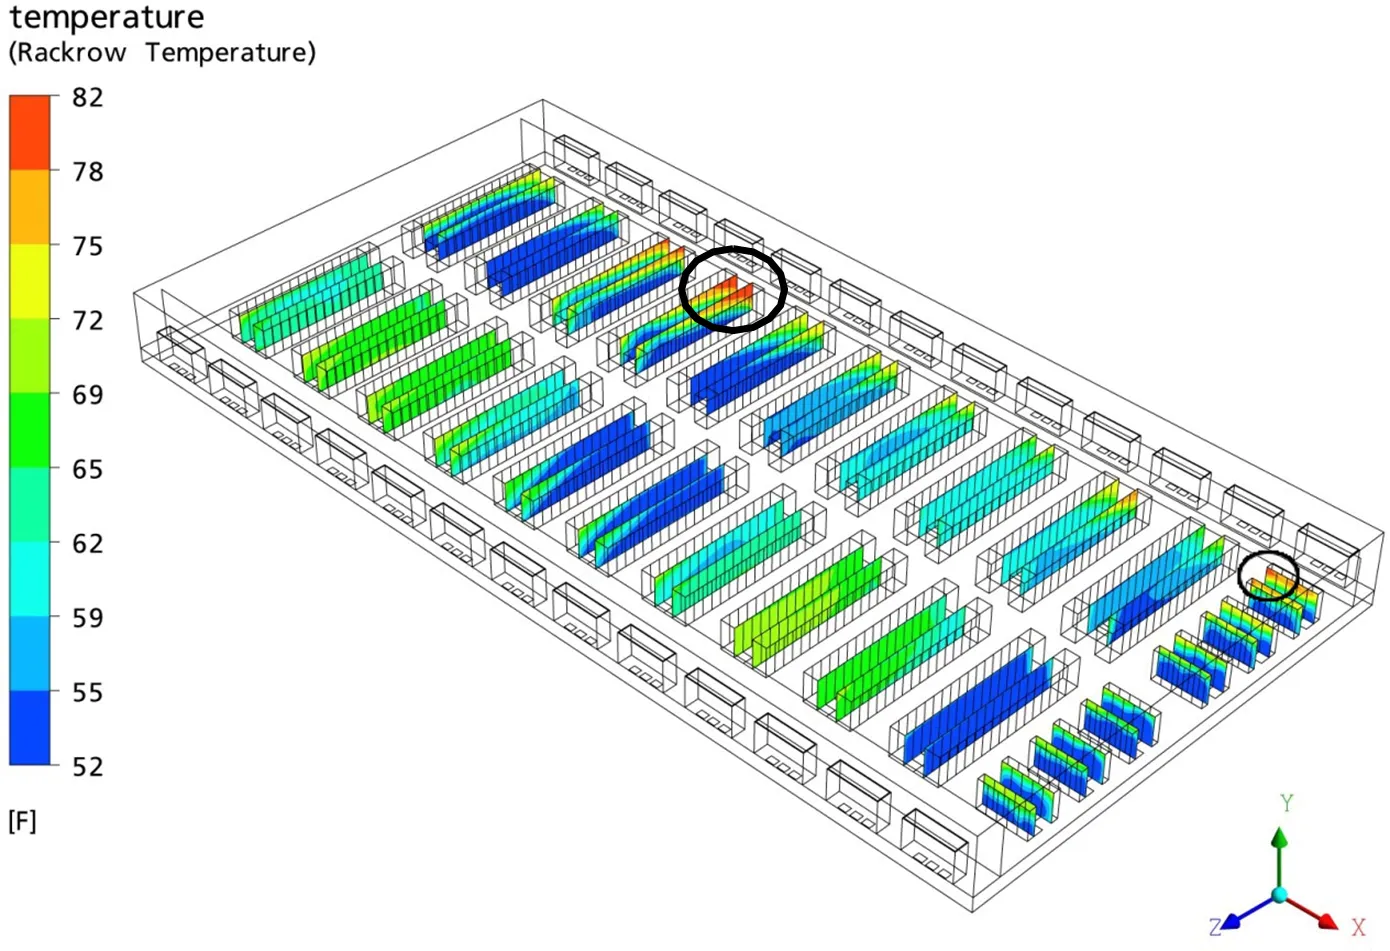
Figure 3
Temperature contours on the rack inlets show racks (circled) on opposite sides of a cold aisle where the temperatures are above the ASHRAE recommended maximum value but within the allowed range
There are three racks in the high density rows and two in the short rows where the maximum rack temperatures exceed the ASHRAE recommended value of 80.6 °F. The temperatures at these locations are all well below the ASHRAE acceptable maximum of 90°F, however. High temperatures on rack inlets are often due to inadequate airflow through nearby perforated floor tiles. If there is not enough supply air, additional air is drawn from the exhausts of other racks instead. This is the case in the high density rows where the temperatures are highest. Poor airflow through perforated tiles is common near CRACs, where the flow under the floor is high and the pressure is low. By contrast, opposing perimeter CRACs in a room design such as this one direct cooling air toward the center of the room, where the colliding jets cause the pressure to rise (Figure 4).
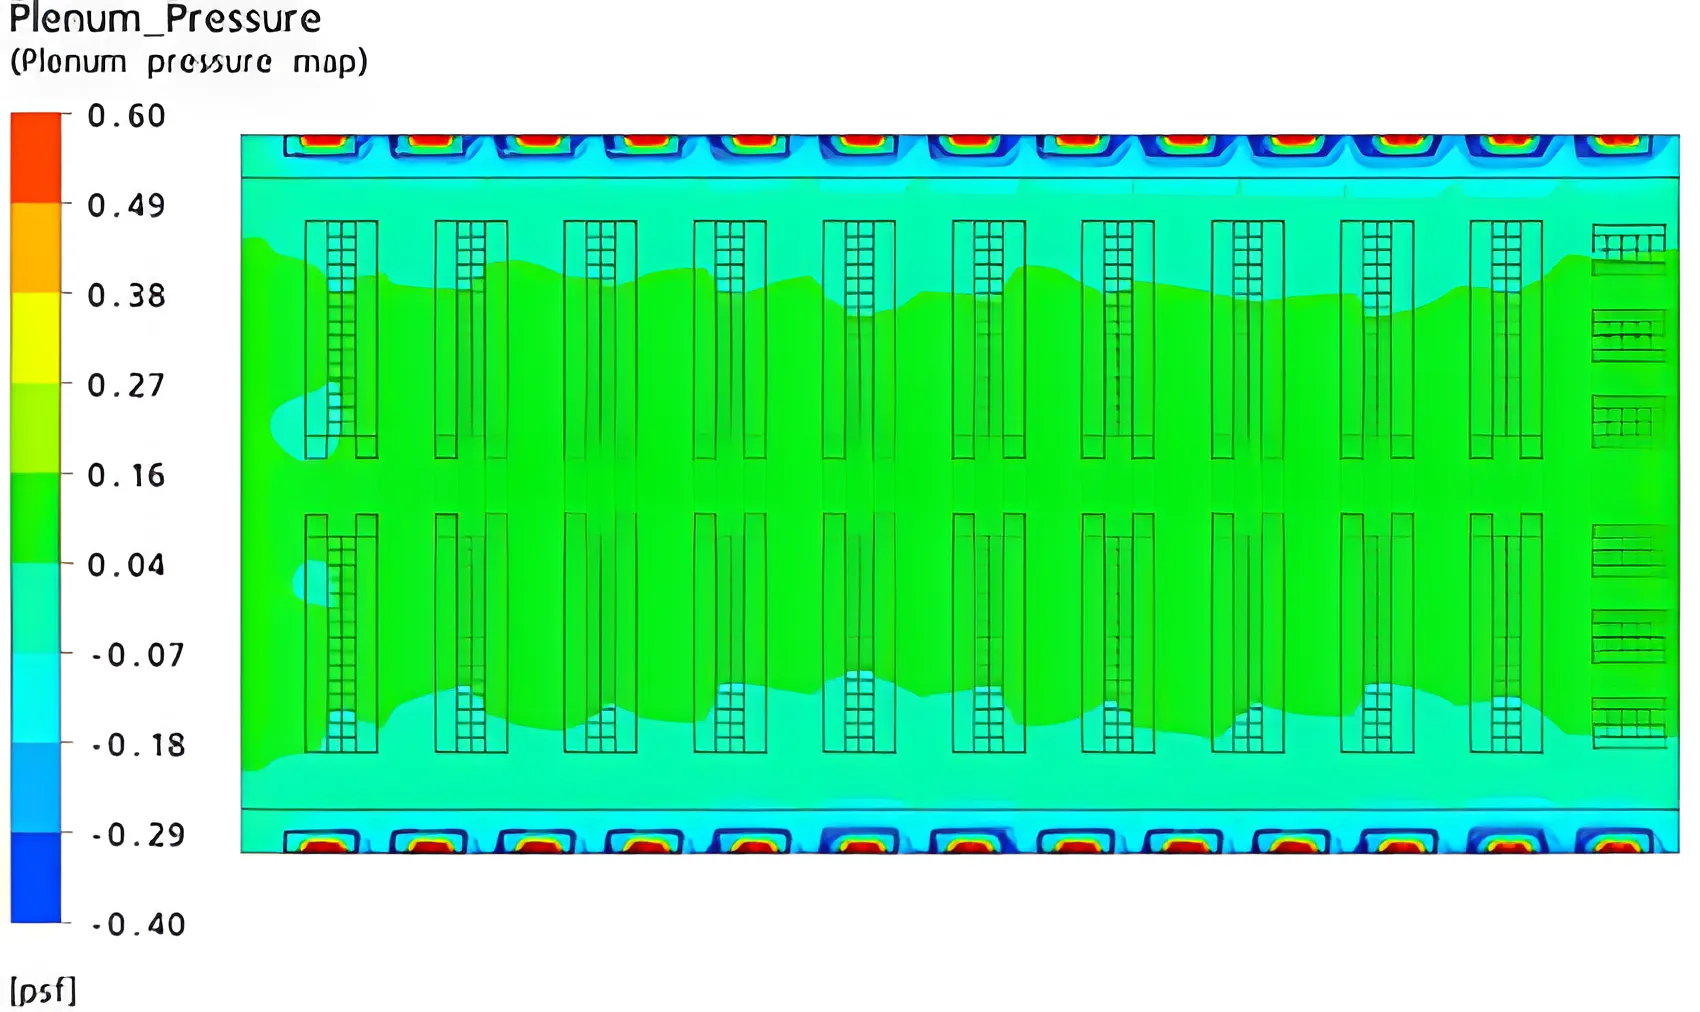
Figure 4
Pressure contours on the midplane of the supply plenum, showing higher pressure under the center aisle than at the edges nearest the CRACs
As a result, the air flow through the perforated tiles is higher in the center of the room than through the tiles that are nearest to the CRACs (Figure 5).
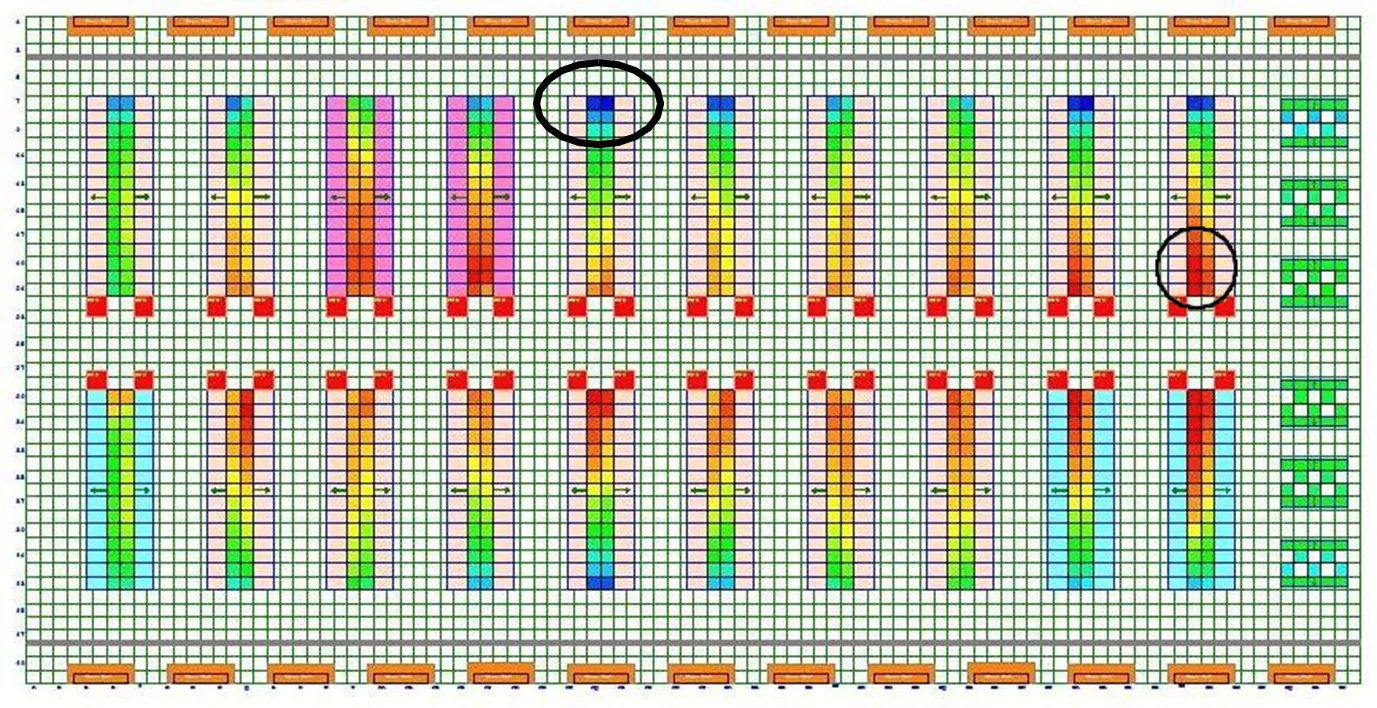
Figure 5
Flow rates through the perforated tiles are greater in the center of the room where the plenum pressure is high and less near the CRACs, where the plenum pressure is low; the circled areas correspond to the tiles with the lowest (-68CFM - from the room into the plenum) and highest (1108 CFM) flow rates
The high temperatures in the short, low heat load rows are not due to inadequate flow through the nearest perforated tiles. Rather, some of that air is short-circuited back to the CRACs, whose fans are more powerful than those on the equipment in the racks. Clearly, the positioning of equipment in the room can play an important role in the cooling scheme. In Figure 6, the heat removed by each of the CRACs is shown.
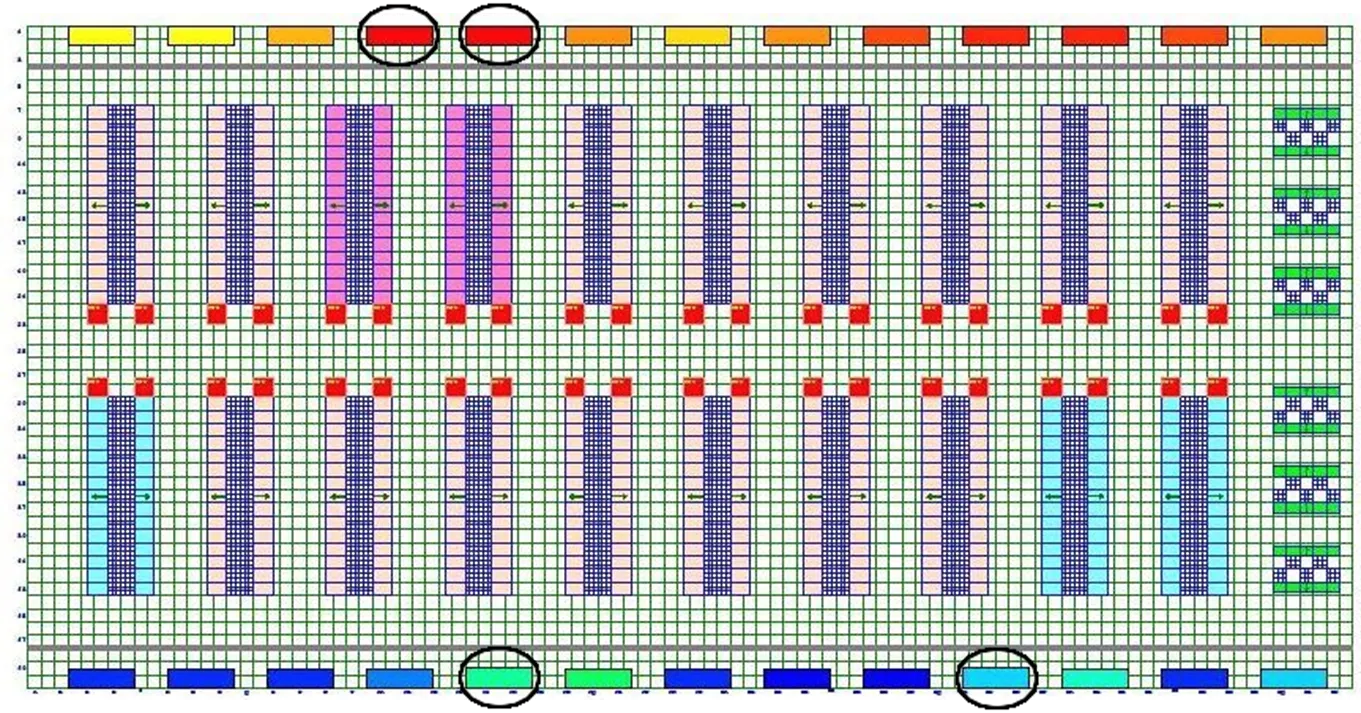
Figure 6
CRAC heat removal with all CRACs operating, ranging from 47 kW (dark blue) to 160 kW (red); the circled CRACs are disabled, one at a time, during the trials
The CRACs on the upper wall work harder than those on the lower wall as a result of the imbalance in the heat distribution in the room. The CRACs nearest the high density servers carry the largest burden, as expected.
It is interesting to note that the minimum heat removed by a CRAC is about 50 kW, while the maximum is about 160 kW Since 50 kW is below the operating range set in the performance data, the CRAC supply temperature is adjusted to keep the return temperature near 75°F, the thermostat setting (the actual return temperature is 72°F for the six units operating at this end of the range). At the high end, the average return temperature is 84°F, above the thermostat temperature but consistent with the data in Table 1. All of the remaining return temperatures fall between these two values.
Trials 1 through 4: 25 CRACs On
While 26 tests could be run with one of the 26 CRACs off each time, only 4 trials are considered in this paper, with one CRAC shut off in each trial. In Figure 5, the selected CRACs to be disabled in the trials are circled. Along the upper wall, two CRACs that are working hardest are selected for the trials to represent the worst-case scenarios (Trials 1 and 2). Two CRACs that are among the hardest working along the lower wall are also shut down in the trials (Trials 3 and 4). In Trial 1, the fourth CRAC from the upper left corner is disabled. The adjacent CRACs on the left and right sides pick up the slack, removing 200 and 207 kW of heat, respectively. As expected, the inlet temperatures near the disabled CRAC are higher (Figure 7) and 29 racks in the circled area exceed the ASHRAE allowed temperature values.
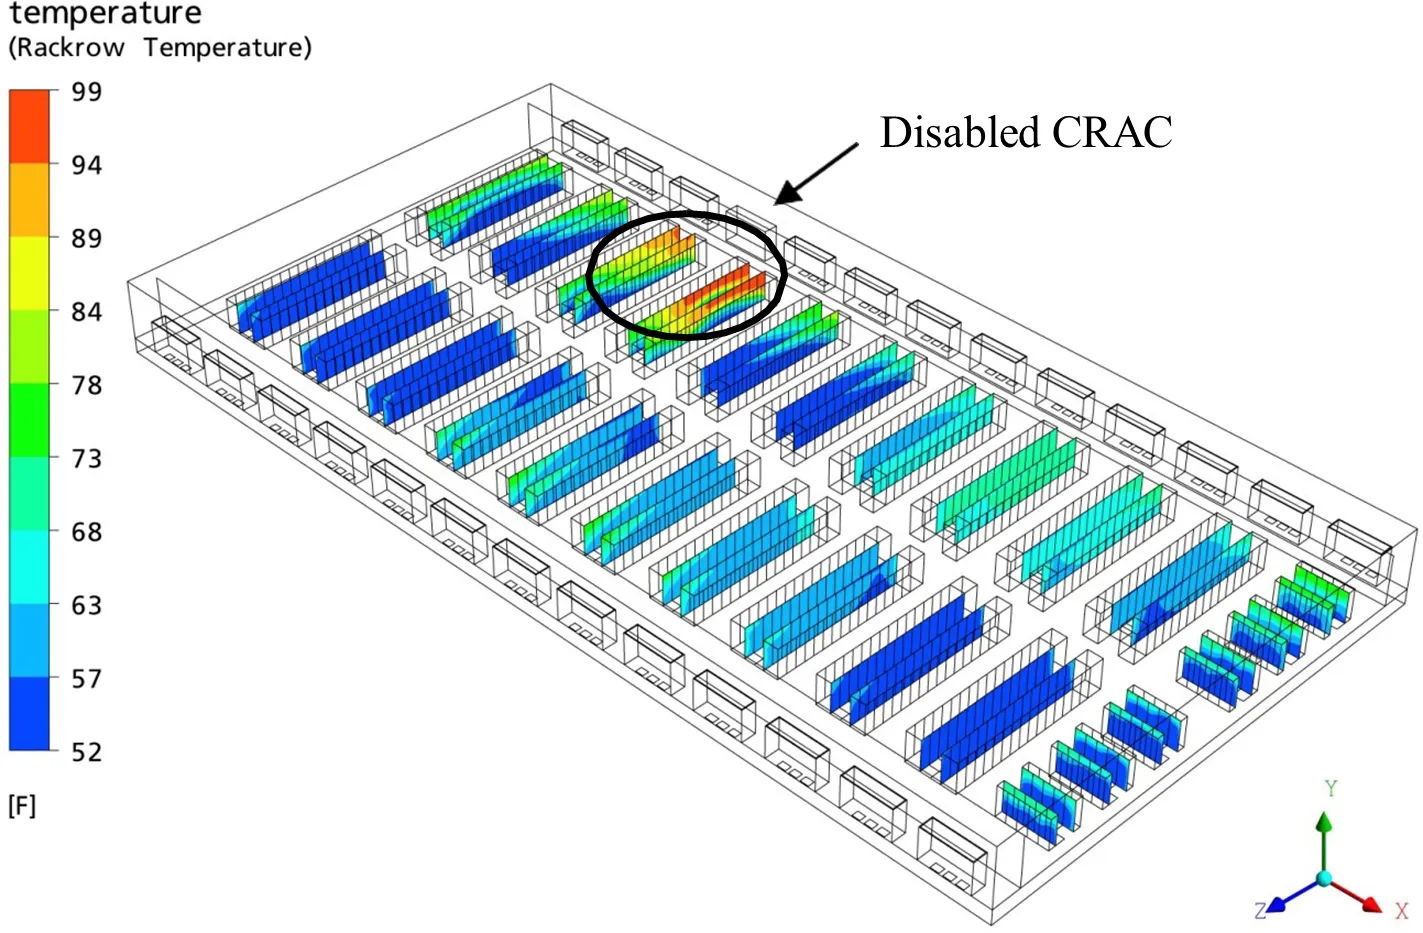
Figure 7
Contours of rack inlet temperature for Trial 1, where the fourth CRAC from the left in the upper rowis shut down; racks in the circled area exceed the ASHRAE allowed temperature maximum
Clearly, if the data center is to run with one CRAC in standby mode, choosing this particular CRAC is not recommended.
In Trial 2, the fifth CRAC from the left on the upper row is disabled. This CRAC is the second of the hardest working CRACs when all are operational. When it goes down, its neighbors on the left and right remove 185 kW and 175 kW, respectively. The rack inlet temperatures for this configuration are shown in Figure 8.
Figure 8
Contours of rack inlet temperature for Trial 2, where the fifth CRAC from the left in the upper row is shut down; racks in the circled areas exceed the ASHRAE recommended temperature maximum; all racks are below the allowed maximum
Compared to Trial 1, the inlet temperatures are much better in this configuration, where all inlet temperatures are below the ASHRAE allowed maximum value (90°F). The performance is not as good as Trial 0 where all CRACs are operating, but it is encouraging that this case passes with one of the most heavily utilized CRACs shut down.
For Trial 3, the fifth CRAC from the left along the lower wall is disabled. For this scenario, none of the CRACs works harder than in the Trial 0 scenario, with 160 kW once again the maximum heat removed by the CRACs near the high density rack rows. Contours of rack inlet temperature are shown in Figure 9.
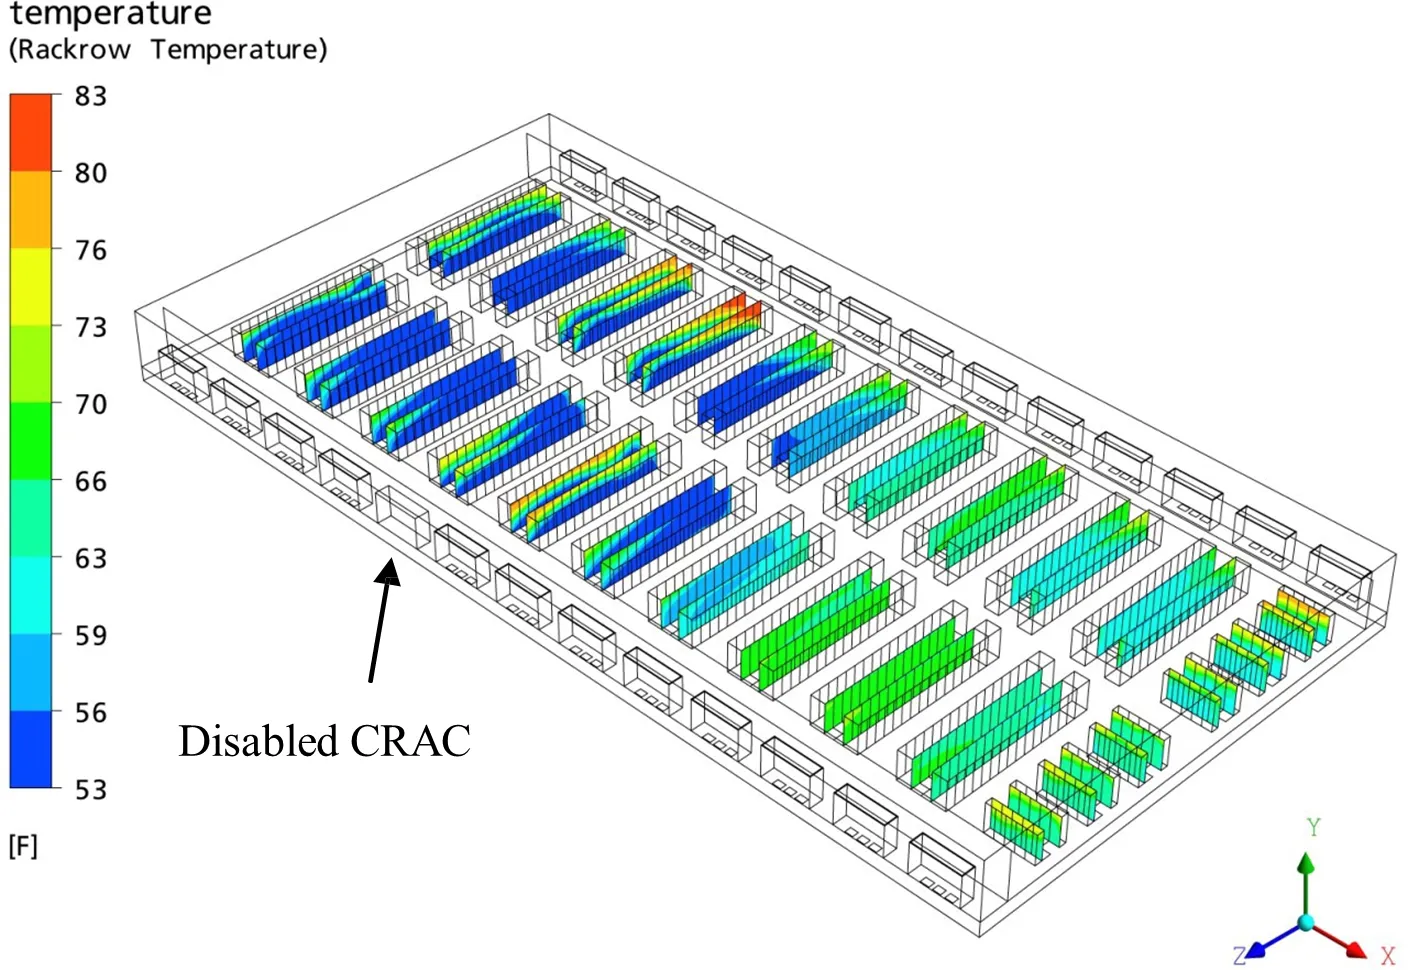
Figure 9
Contours of rack inlet temperature for Trial 3, where the fifth CRAC from the left along the lower wall is shut down; all racks fall within the ASHRAE allowed temperature range
For this case, 8 racks have inlet temperatures that exceed the ASHRAE recommended maximum value, but all fall below the ASHRAE allowed maximum value. This scenario is comparable to Trial 0 where all CRACs are on. The results for Trial 4 (Figure 10) are about the same: ten racks do not meet the ASHRAE recommended temperature maximum but all fall below the allowed maximum value.
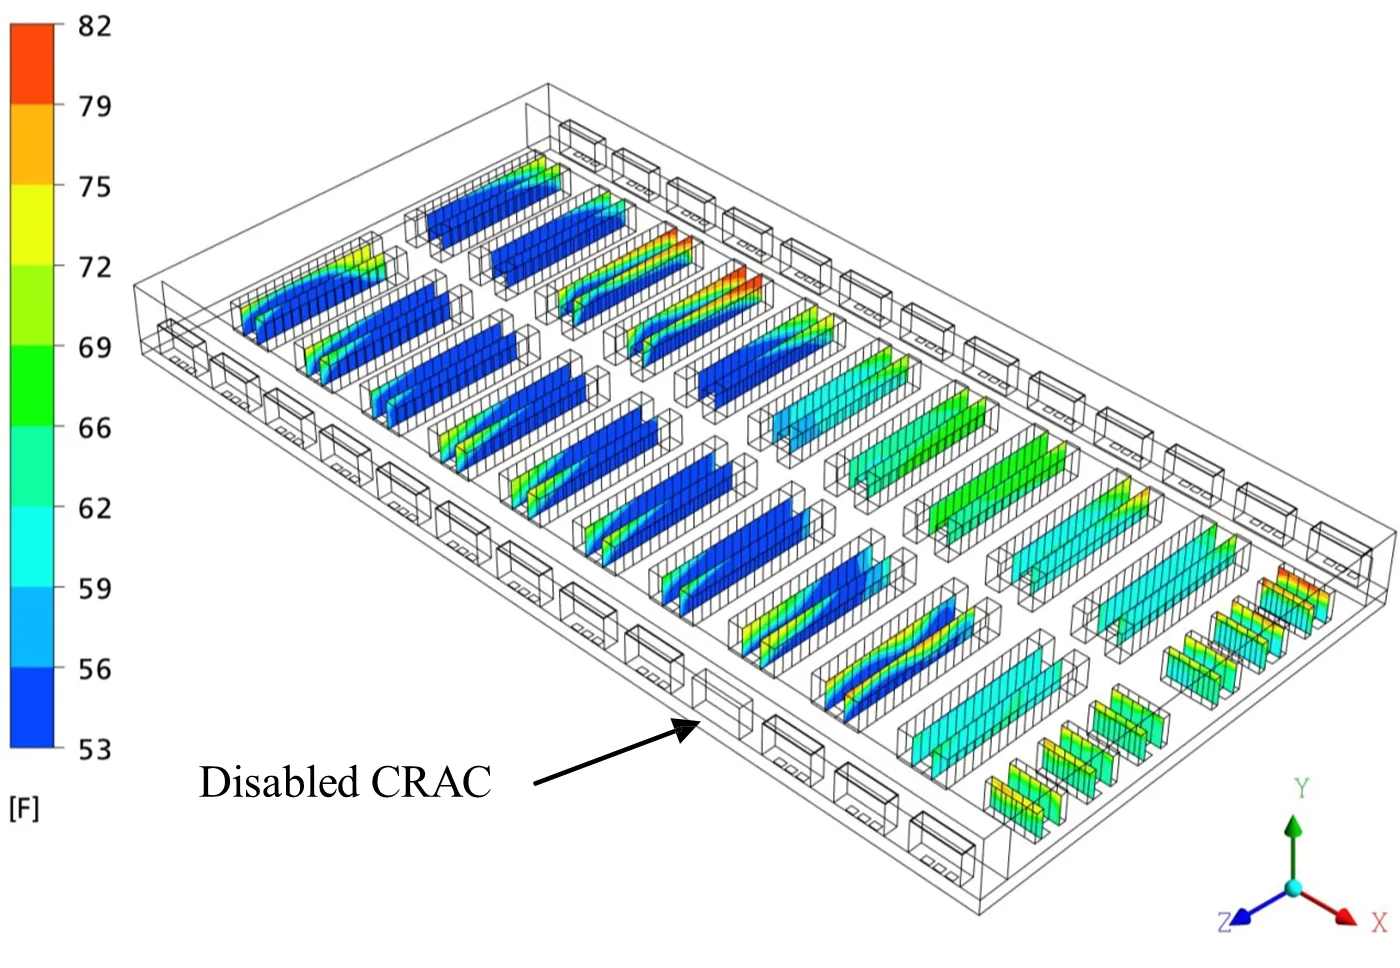
Figure 10
Contours of rack inlet temperature for Trial 4, where the fourth CRAC from the right along the lower wall is shut down; all racks fall within the ASHRAE allowed temperature range
The third and fourth trials suggest that shutting down any one of the CRACs along the lower wall will not adversely impact the cooling properties of the room.
Modifying the Design
There are two important conclusions that can be drawn from the simulations examined so far. First, because there is higher plenum pressure and better flow through the perforated tiles near the center aisle of this data center, high density equipment could be placed closer to the center aisle than to the CRACs. In the present model, high density rows are used, but a better orientation might be one in which the high density equipment is spread out over several rows, in racks nearest the center aisle. Second, the room can function with one CRAC off for all but the first trial, where the reduced cooling capacity near the high density rows and poor flow through some of the perforated tiles combine to starve many of the racks of cooling air. The racks respond by drawing air from the exhausts of nearby equipment.
Using CFD, it is a straightforward matter to modify the design of the data center to see if the performance of Trial 1 can be improved while keeping the performance of the other trials unchanged. Two modified designs are considered. In the first, the high density servers are relocated near the center aisle and distributed among 12 rows (Figure 11).
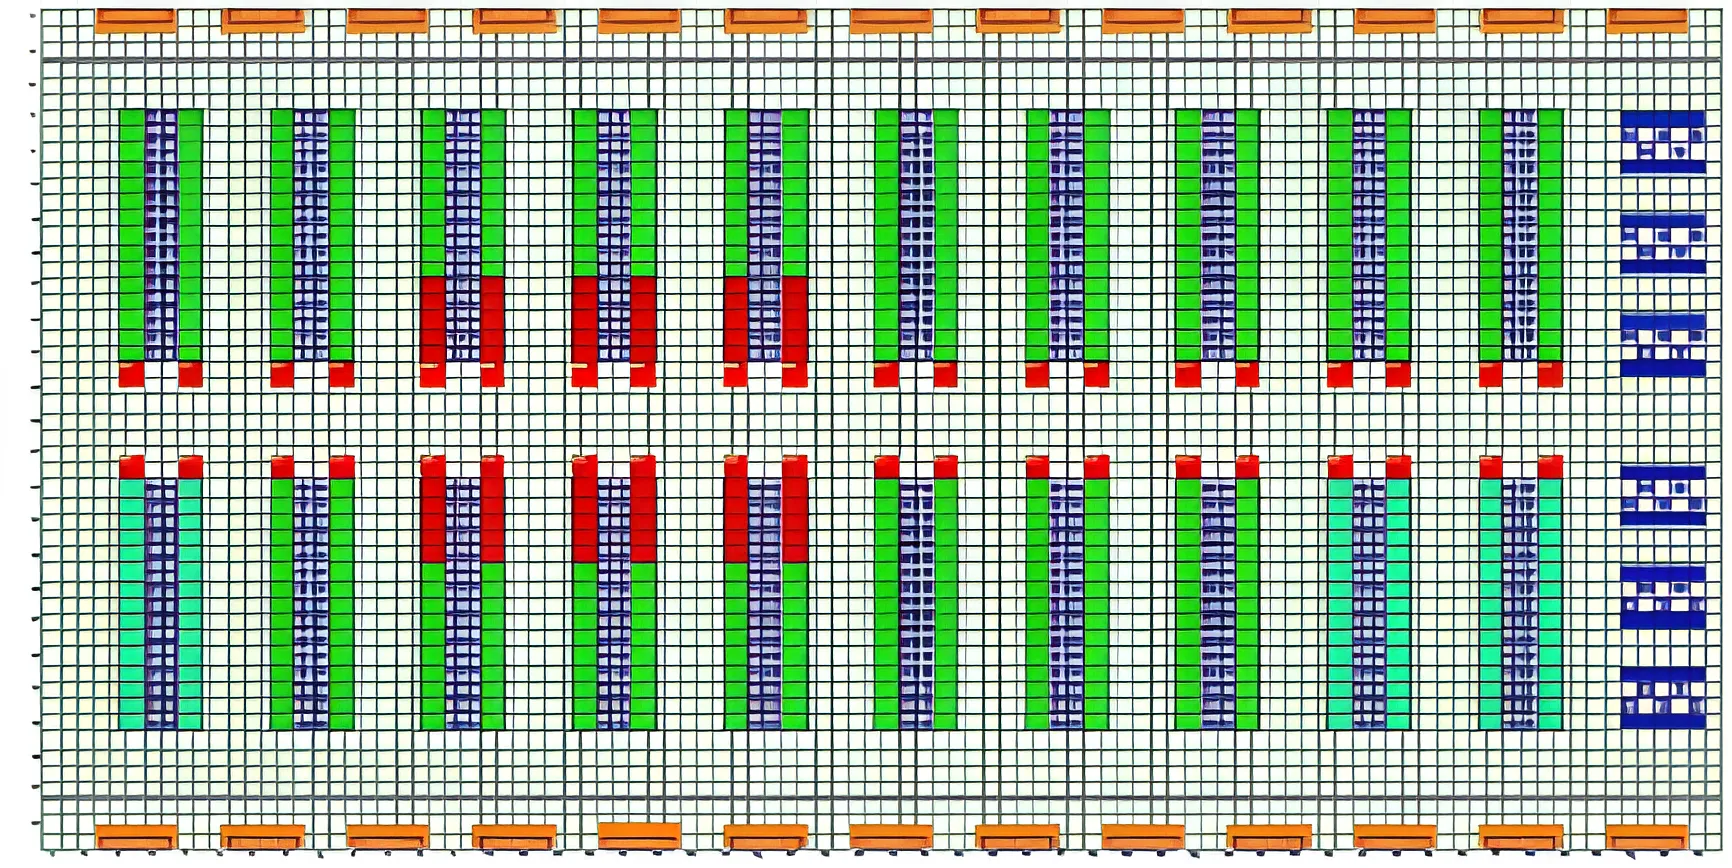
Figure 11
In the first modified design, the high density racks are distributed among 12 rows with positions near the center aisle where the flow from the supply plenum is strongest
In the second, cold aisle containment is applied to the original design using baffles with a 10% open area (Figure 12).
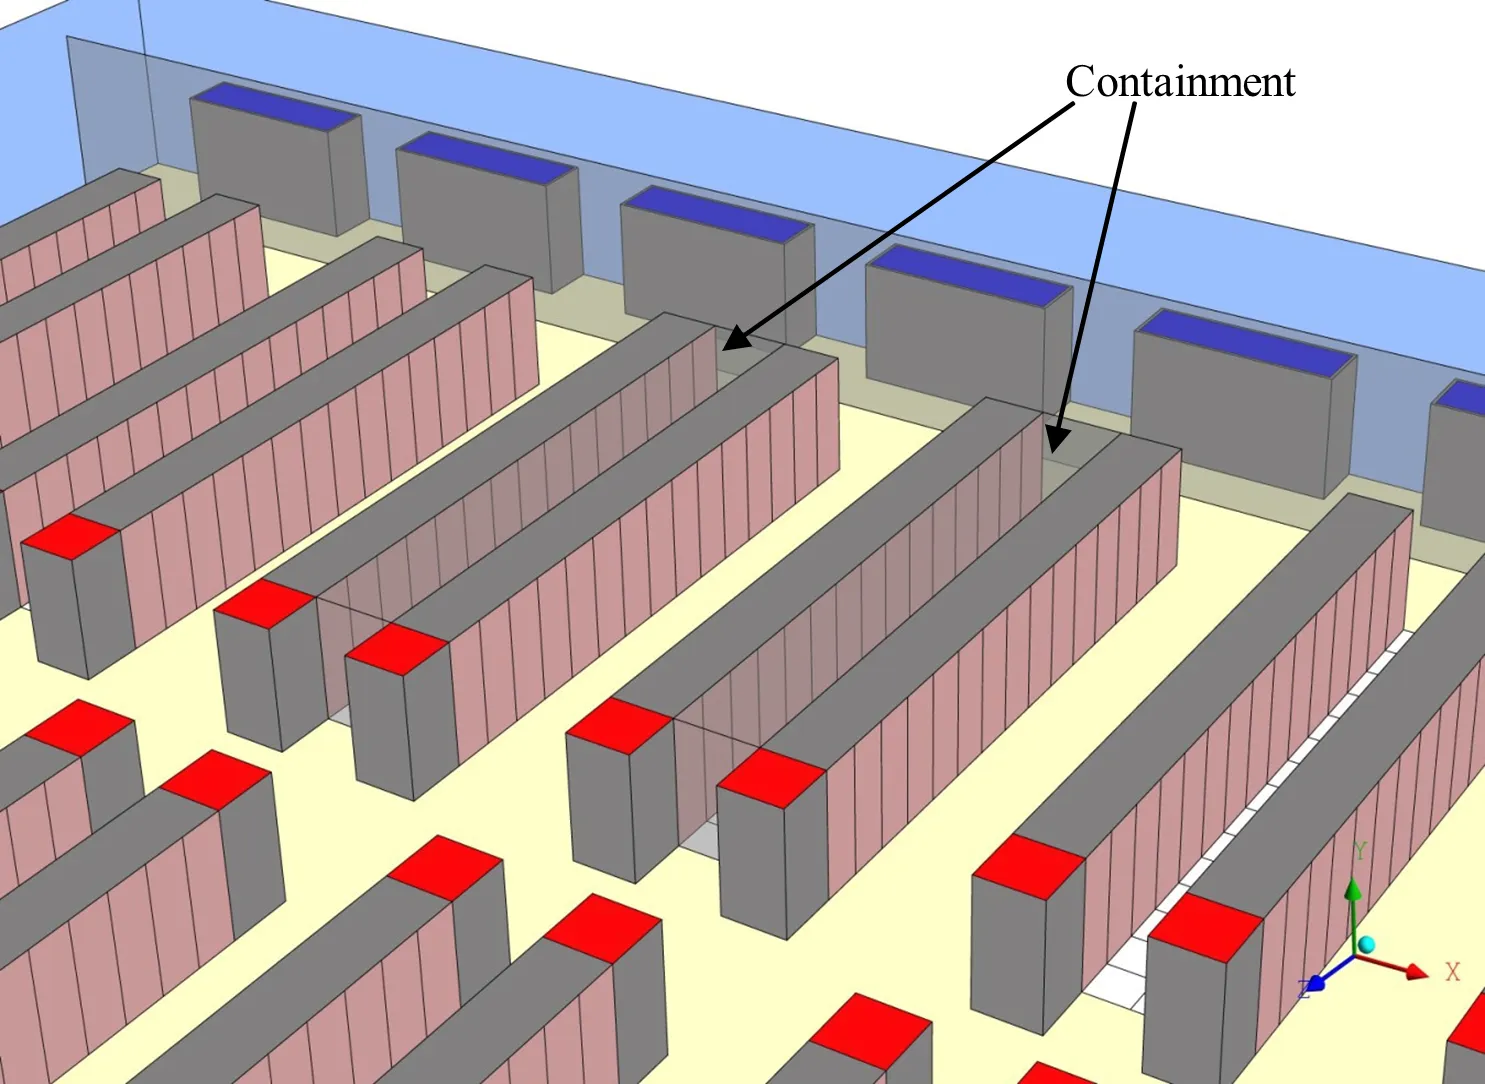
Figure 12
In the second modified design, cold aisle containment is applied to the original high density rack rows
The results of the trials indicate that the modified designs are better when all CRACs are operating and are better or comparable when one CRAC is shut down. In the original design with all CRACs operating, four racks had inlet temperatures above the ASHRAE recommended maximum but all racks were below the ASHRAE allowed maximum value. For Modified Design #1, all racks were within the recommended temperature range when all CRACs were on. For Modified Design #2, only two racks were above the recommended temperature maximum while all were below the allowed value. Thus with all CRACs working, all of the designs are comparable, with the first modified design slightly better than the others. When one CRAC is shut off, the designs perform very differently. Trial 1 is the most difficult one for the cooling system, since it has the CRAC nearest the high density rack rows shut down. This trial therefore best illustrates the contrast between the designs. In the original design, 56 racks were above the recommended maximum value while 29 were above the allowed value. For Modified Design #1, 71 racks were above the recommended maximum value but the number above the allowed maximum value dropped to 23. For Modified Design #2, only 5 were above the recommended maximum value and none was above the allowed maximum value. Clearly, the introduction of cold aisle containment makes the most difficult CRAC shutdown scenario acceptable—better than the original or first modified design.
For the remaining trials, the second modified design continues to do better than either the original or first modified designs. A summary of the findings is presented in Table 2.
| Trial | Original Design | Modified Design #1 | Modified Design #2 | |||
|---|---|---|---|---|---|---|
| Number with T > 80.6°F | Number with T > 90°F | Number with T > 80.6°F | Number with T > 90°F | Number with T > 80.6°F | Number with T > 90°F | |
| 0 | 4 | 0 | 0 | 0 | 2 | 0 |
| 1 | 56 | 29 | 71 | 23 | 5 | 0 |
| 2 | 37 | 0 | 36 | 0 | 4 | 0 |
| 3 | 8 | 0 | 35 | 0 | 0 | 0 |
| 4 | 10 | 0 | 2 | 0 | 1 | 0 |
Table 2
The number of racks whose maximum inlet temperature falls above the ASHRAE recommended or allowed value
Conclusion
Three designs for a large data center with redundant cooling were compared in this example. While the heat-generating equipment in the room could be cooled using 25 Liebert FH740 CRACs, 26 of these CRACs are used in order to build some redundancy into the design.
When the data center was run with all 26 CRACs in operation, all three of the designs fared well. The first modified design, in which the high density racks are clustered near the center aisle, had the best performance under these conditions. However, to save on energy, trials were run in which one of the CRACs was in standby mode and only 25 were used to cool the room. While this could be considered the normal operating mode, it could also represent the scenario when one of the 26 CRACs fails if all are operational in normal mode.
The trials with 25 CRACs on included one (Trial 1) in which the most heavily loaded CRAC, that near the high density rows in the original design, was disabled. The original and first modified design did not provide adequate cooling for the equipment for this case but the second modified design, in which cold aisle containment was applied to the high density rows, performed much better. For this design, all racks had inlet temperatures that were below the ASHRAE allowed maximum value (90°F) and only 5 had temperatures above the ASHRAE allowed maximum value (80.6°F). This trial was the most demanding on the system, and it clearly showed that with cold aisle containment, the data center could run comfortably with any 25 of the 26 CRACs in operation, with one in standby mode.