WP109: Reducing the Annual Cost of a Telecommunications Data Center
Introduction
The facilities managers for a large internet service provider have known for a while that one of their data centers is over-cooled. Over-cooling translates into unnecessary energy consumption and expense, so the managers knew that some changes to the data center were needed. Several options were possible, such as shutting down one or more of the cooling units. Many questions arose, however. For example, what would be the consequences of shutting down a CRAC? Would it be possible to shut down two? If so, which two? Could the supply temperatures be increased? To answer these questions, the operators decided to use computational fluid dynamics (CFD), a tool that uses airflow predictions to demonstrate how effectively the cooling air reaches—and removes heat from—the equipment in the room. Using CFD-based modeling techniques for quantifying the efficiency of the data center, different energy-saving strategies can be compared before physical changes to the room are made.
Problem Description
The CFD modeling is done using CoolSim software from Applied Math Modeling. The raised-floor data center is 4720 sq. ft. in size (80 ft x 59 ft) and makes use of a ceiling plenum return. The 2 ft supply plenum, 15 ft room height, and 5 ft ceiling plenum combine to form a space that is 22 ft high (see Figure 1).
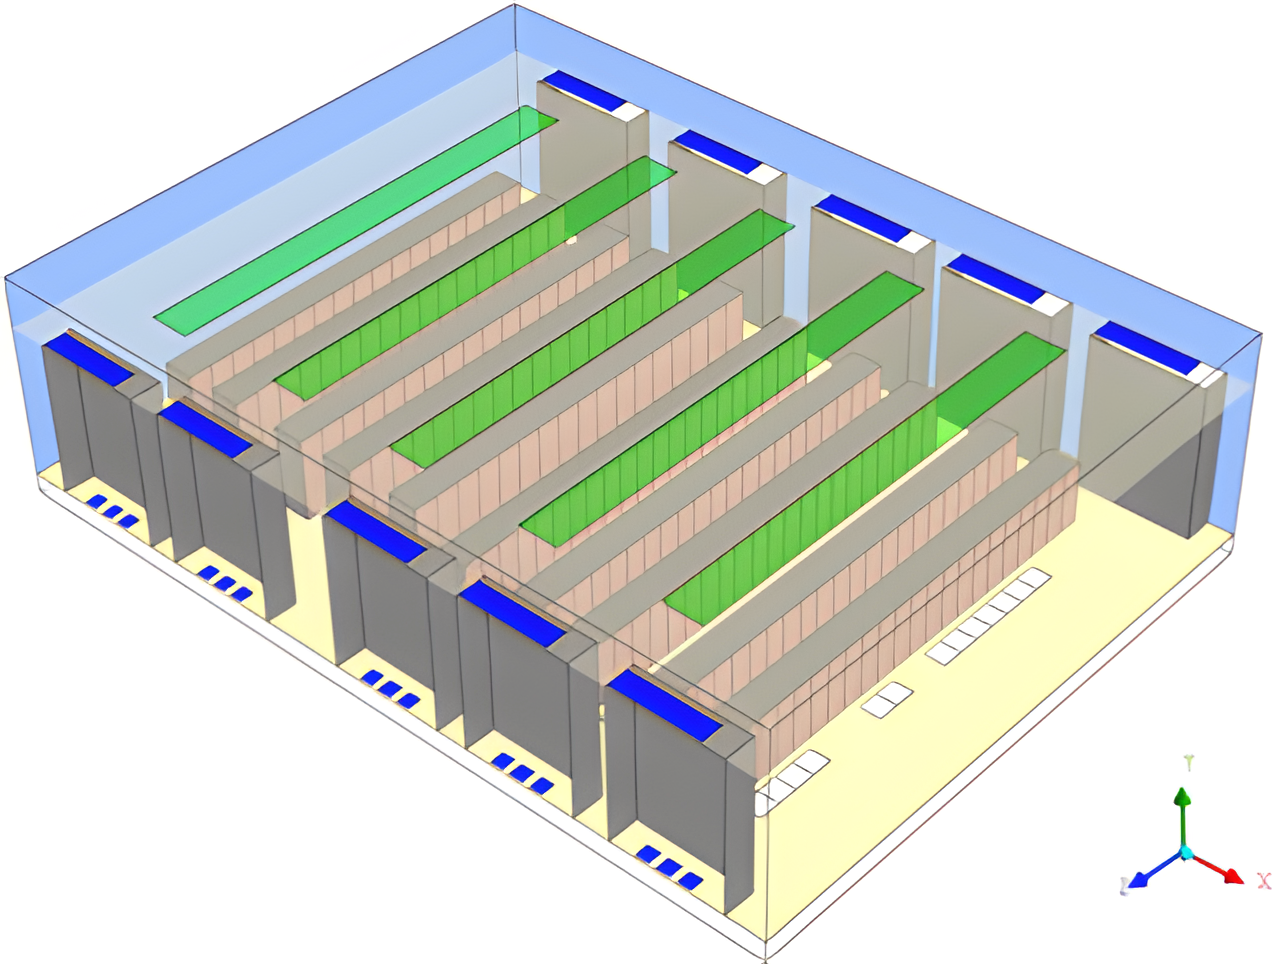
Figure 1
Isometric view of the room geometry, showing the rack rows (pink and gray), CRACs (blue tops), perforated floor tiles (white) and overhead ceiling grilles (green)
The data center contains ten rows of equipment with either 17 or 21 racks per row. The heat loads in the racks vary from 10W up to 7.8 kW, as shown in Figure 2.
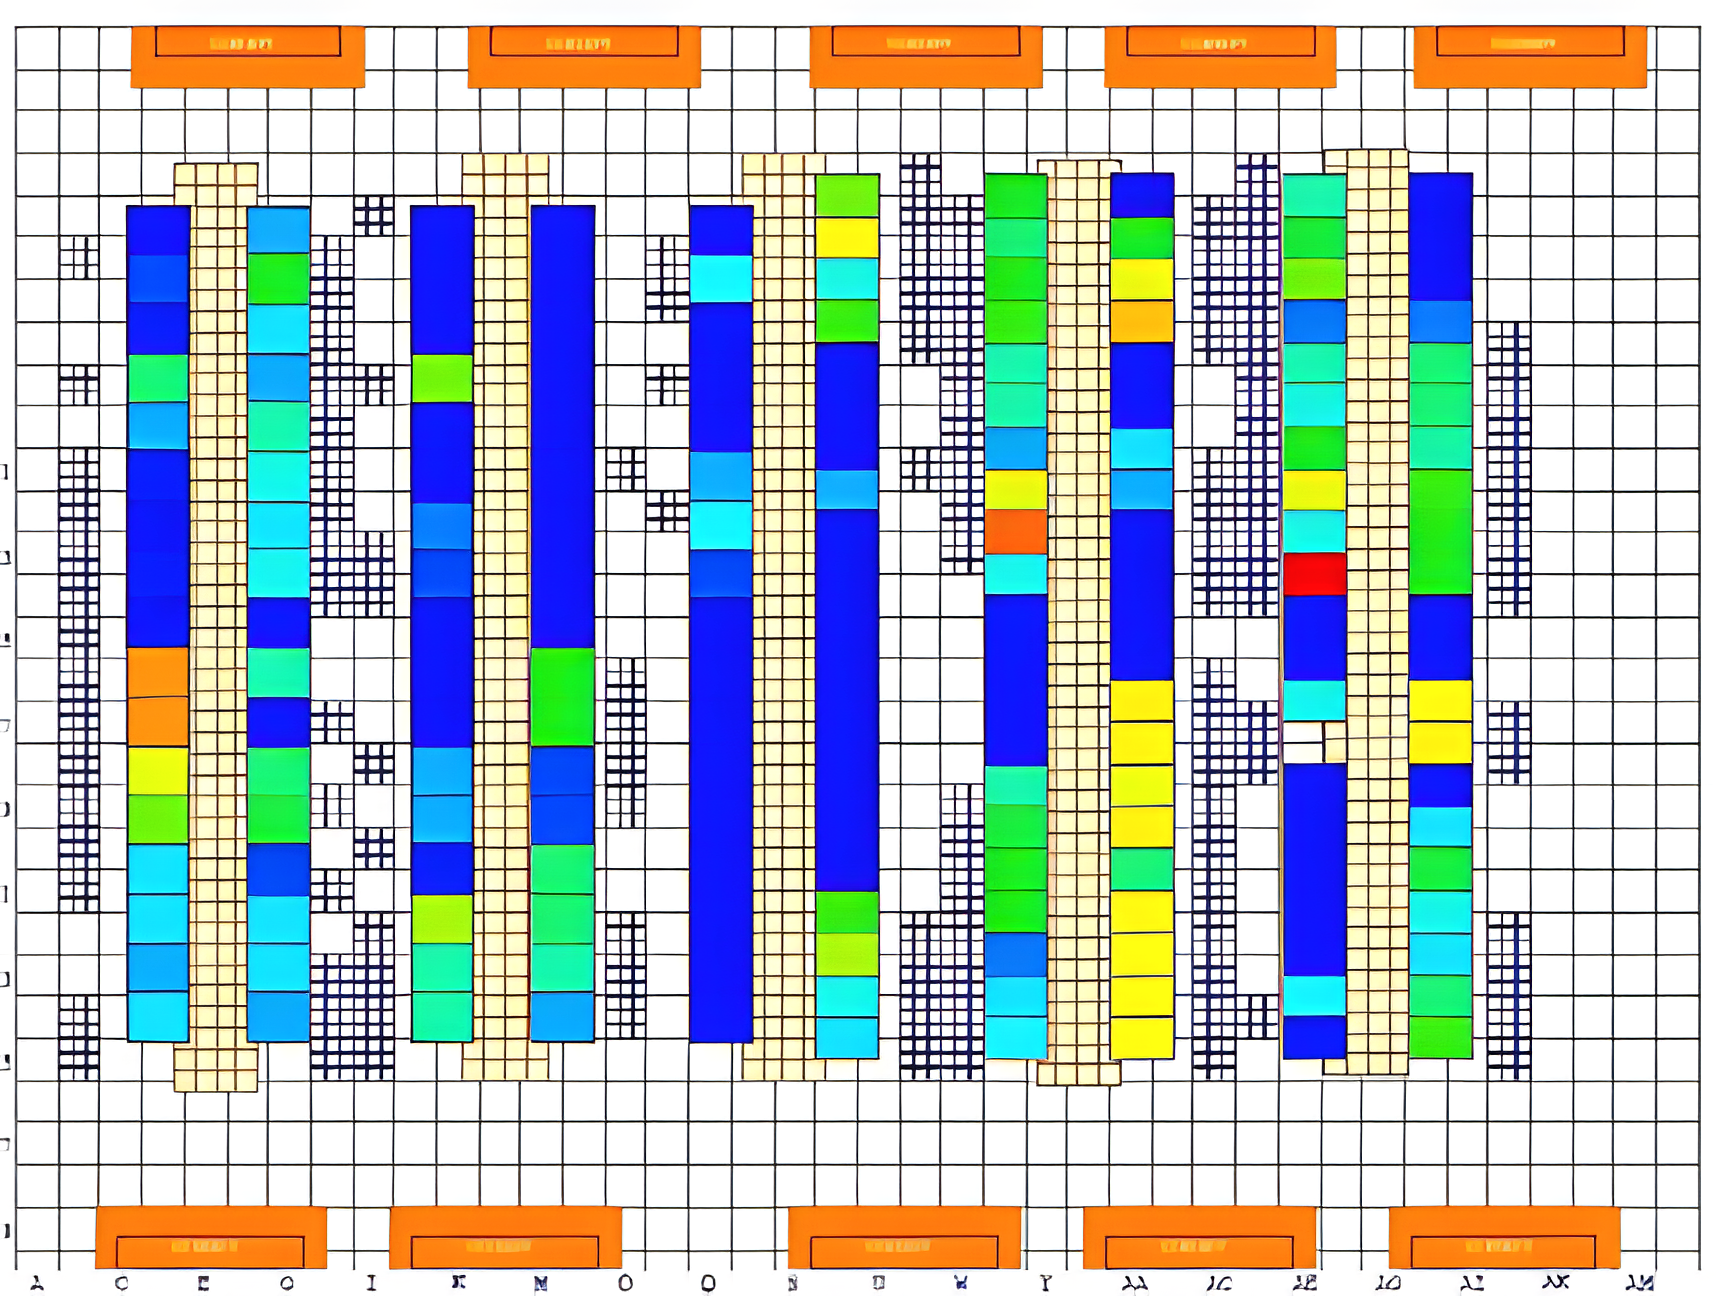
Figure 2
Rack heat loads, which range from a low of 10W (dark blue) to a high of 7.8 kW (red); while there are only two 10 W racks, there are several 50 W racks, which also appear dark blue
The total IT heat load in the room is 363 kW with a density of 6.9 W/sq. ft.
Five Liebert DS105AU CRACs are positioned on opposing walls for a total of ten CRACs in the room. These direct expansion (DX) cooling units are controlled in zones, each of which consists of two opposing CRACs (Figure 3). The data center was originally designed for a 1 MW heat load, but in its current use, the IT load is only about one-third of that value (363 kW). Assuming a 20°F temperature rise across all racks, 57,020 CFM of cooling air is needed for the present heat load. Each CRAC delivers 14,500 CFM, so with all ten CRACs operating, a total of 145,000 CFM is generated, which is almost three times the needed amount. Thus in normal operating mode, two zones are disabled, so that only six of the ten CRACs are in use. The disabled cooling zones, 2 and 4, are shown in Figure 3.
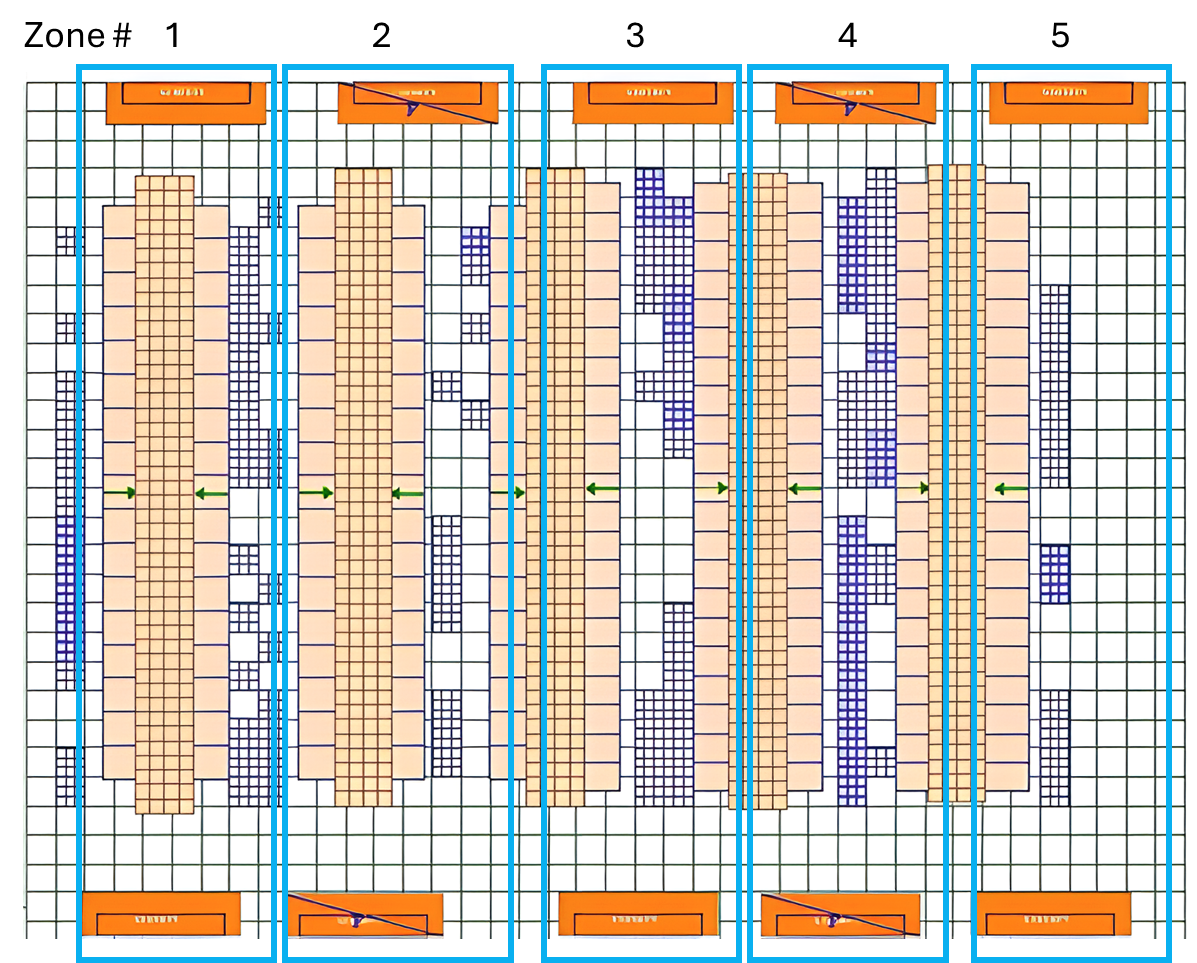
Figure 3
Five cooling zones, each of which consists of a pair of opposing CRACs; under normal operating conditions, Zones 2 and 4 are shut down
For this configuration, the six active CRACs supply 87,000 CFM of cooling air, which is about 50% more than required for the heat load. The total cooling capacity of the six CRACs exceeds the heat load by approximately the same amount. Measurements of supply air temperatures place the range between 50°F and 68°F. Return temperatures are also available for comparison with values predicted by the CFD simulation. Once a CFD model is created and validated, alternative energy optimization scenarios can be investigated, including disabling additional CRACs, hot or cold aisle containment, and modification to the CRAC cooling parameters. In this study, the first and third of these options will be considered.
Preliminary Results for the Baseline Case
The first CFD model created for this study (the baseline case) corresponds to the data center operating in normal mode, with six CRACs operational, as shown in Figure 3. Boundary conditions for the simulation include the heat load and flow rate associated with each rack and the supply temperature and flow rate associated with each CRAC. The measured supply and return temperatures are shown in Table 1, along with the predicted return temperatures from the CFD model.
| CRAC # | Measured Supply Temperature (°F) | Measured Return Temperature (°F) | Predicted Return Temperature (°F) | Error (%) |
|---|---|---|---|---|
| 1 | 51.6 | 70.0 | 67 | 4.3 |
| 2 | 50.7 | 69.8 | 67 | 4.0 |
| 5 | 53.5 | 71.2 | 69 | 3.1 |
| 6 | 53.8 | 71.6 | 69 | 3.6 |
| 9 | 67.9 | 75.4 | 74 | 1.9 |
| 10 | 62.4 | 73.7 | 74 | 2.3 |
Table 1
Measurements of supply and return temperature and predicted return temperature for the baseline case; the error in the predicted return temperature is under 5% for all CRACs
In all but one case, the predicted temperatures are below the measured values. Often, when the CFD model under-predicts the return temperature on every CRAC, it means that either the heat loads are under-represented or the CRAC flowrates are too high. In this data center, it could be one of these factors or a combination of both, but the effect is small, since the error is below 5% in all cases. A validation of the preliminary model, such as this, is an important step if modifications are to be made. A demonstration that the base model accurately captures the physics to within an acceptable margin of error means that it can be used to correctly predict trends if one or more changes are made.
Contours of rack inlet temperature for the baseline case are shown in Figure 4.
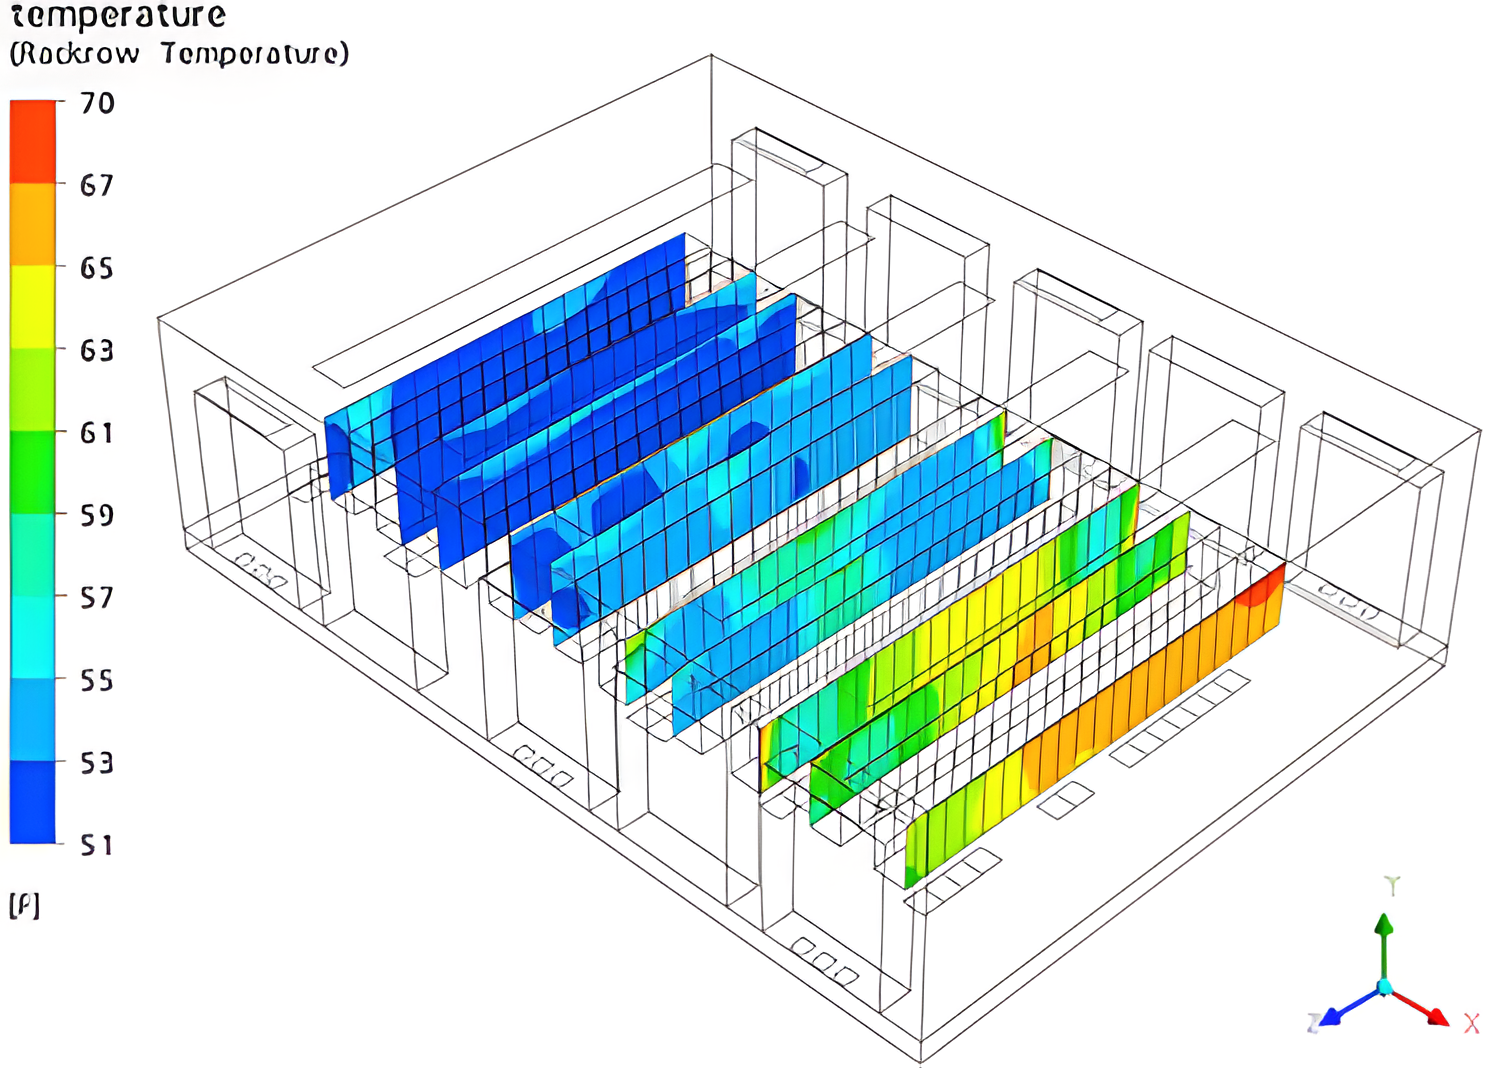
Figure 4
Rack inlet temperatures for the baseline case, in which the CRACs in Zones 2 and 4 are inactive
The temperatures all fall below the ASHRAE recommended maximum value of 80.6°F. The maximum rack inlet temperature is a good metric to follow when comparing cooling strategies. For an over-cooled data center, however, the minimum rack inlet temperature is also important to follow. According to the ASHRAE guidelines, the rack inlet temperature should not go below 64.4°F, although the allowed minimum value is 59°F. For the baseline case, at least half of the racks have inlet temperatures that are too cold.
Data Center Metrics
PUE and DCIE
A number of metrics have been defined in recent years that can be used to gauge the efficiency of a data center. Metrics can also be used to test whether changes to the data center bring about reduced (or increased) power demands. One of the most popular metrics is the Power Utilization Effectiveness, or PUE, defined as the ratio of total facility power to total IT power.
\[ \text{PUE}=\frac{\text{total facility power}}{\text{total IT power}} \tag{1} \]The total facility power includes that needed to run the CRACs (chillers and fans), IT equipment, battery backup systems, lighting, and any other heat-producing devices. Thus PUE is always greater than 1, but values that are close to 1 are better than those that are not. A typical value is 1.8, a good value is 1.4, and an excellent value is 1.2.
COP
The largest contributor to the total facility power is the cooling system, comprised of the heat exchangers (chillers, condensers and cooling fluid pumps, for example) and fans. The heat exchanger portion of the CRAC is a heat pump, whose job it is to move heat from one location (inside the room) to another (outside). Heat pumps are rated by their coefficient of performance, or COP. The COP is the ratio of the heat moved by the pump to the work done by the pump to perform this task. The work done by the pump encompasses the heat exchanger work and does not include the CRAC fans. The COP can also be expressed as a power ratio, making use of the rate at which heat is moved (in watts, say) or work is done (again, in watts)
\[ \text{COP}=\frac{\text{heat moved}}{\text{work done}} \tag{2} \]Using more practical terms, the COP is the ratio of the total room heat load to the power needed to run the chillers, condensers and other heat rejection equipment. For data center cooling equipment, COP values range from 2 to 5, with larger numbers corresponding to better heat pumps. Note that an alternative definition of COP could be made for the data center as a whole, rather than just for the heat rejection system. In this alternative definition, the work done would include the power used to run the CRAC fans. For the purposes of this paper, the traditional definition of COP is used.
Return Temperature Index™
The Return Temperature Index, a trademark of ANCIS Inc., is a percentage based on the ratio of the total demand air flow rate to the total supply flow rate.
\[ \text{RTI}=\frac{\text{total demand air flow rate}}{\text{total supply air flow rate}} \tag{3} \]Alternatively, it can be computed using the ratio of the average temperature drop across the CRACs to the average temperature rise across the racks. In either case, a value of 100% indicates a perfectly balanced airflow configuration, where the supply equals the demand. Values with RTI < 100% have excess cooling airflow, so short-circuiting across the CRACs exists. Values with RTI > 100% have a deficit of cooling air, so there is recirculation from the rack exhausts to the rack inlets. It is best to have RTI values that are less than, but close to 100%.
Rack Cooling Index™
The Rack Cooling Index, a registered trade- marked of ANCIS Inc., is computed using the average number of degrees that the rack inlet temperature falls above (or below) the ASHRAE recommended temperature range (64.4°F to 80.6°F). One index is defined for temperatures above the range (RCIHi) and another for temperatures below the range (RCILo). For the high side:
\[ \text{RCI}_{Hi}=\left[1-\left(\frac{\sum_{i=1}^n(T_i-T_{R,Hi})}{N\times(T_{A,Hi}-T_{R,Hi})}\right)\right]\times 100 \tag{4} \]where:
- \(T_i\) is the maximum inlet temperature for the ith rack
- \(T_{R,Hi}\) is the ASHRAE max recommended tmperature (80.4°F)
- \(T_{A,Hi}\) is the ASHRAE max allowable tmperature (89.6°F)
- \(N\) is the number of racks exceeding the max recommended temperature
The index on the low side is similarly defined:
\[ \text{RCI}_{Lo}=\left[1-\left(\frac{\sum_{i=1}^n(T_{R,Lo}-T_i)}{N\times(T_{R,Lo}-T_{A,Lo})}\right)\right]\times 100 \tag{5} \]where:
- \(T_i\) is the minimum inlet temperature for the ith rack
- \(T_{R,Lo}\) is the ASHRAE minimum recommended temperature (64.4°F)
- \(T_{A,Lo}\) is the ASHRAE minimum allowable temperature (59°F)
- \(N\) is the number of racks below the minimum recommended temperature
Ideally, no racks should be outside the recommended range, so the ideal value is 100% for both indices. Values between 90% and 100% are in the acceptable to good range, while values under 90% are considered poor.
Metrics for the Baseline Data Center
Using the metrics defined above, the baseline data center configuration can now be evaluated using a combination of measurements and CFD results. Because the cooling system is controlled in five separate zones, the facility managers have been able to measure the electric power needed to run the heat rejection system (the CRAC power minus the fans). The measured value, 269.1 kW, is a snapshot of one day’s power demand for the three normally functioning zones. They have also determined that each CRAC uses 8 kW to run its fan, so the total CRAC fan power is 48 kW. Combining these, the total measured cooling power is 269.1 + 48 = 317.1 kW.
The total rack heat load in the room is 363 kW, and this includes PDUs, which are rack mounted. If 5% of this value is assumed for additional support infrastructure (lights, etc.), the total IT heat load in the room is 363 + 18.2 = 381.2 kW.
Taking the most conservative approach described above, the CRAC fan power will be included in the room heat load. Assuming that all of the CRAC fan power will eventually be converted to heat, the total room heat load becomes 381.2 + 48 = 429.2 kW.
The ratio of the total room heat load to the power needed to run the heat rejection system (269.1 kW) is the COP:
\[ \text{COP}=\frac{429.2}{269.1}=1.59 \tag{6} \]This value is low, indicating that the data center could support more equipment for the amount of power being delivered to the cooling system. Alternatively, it suggests that shutting down one or more of the CRACs is an option to be considered.
To calculate the PUE, the total facility power is needed. This is simply the total cooling power (317.1 kW) plus the total room heat load (429.2 kW), or 746.3 kW.
Dividing the total facility power by the total IT heat load (382.1 kW), the PUE is:
\[ \text{PUE}=\frac{746.3}{381.2}=1.96 \tag{7} \]The return temperature index can be computed using the boundary conditions used for the CRACs and IT equipment. The total supply air flow from the CRACs is 87,000 CFM. The demand air flow from the IT load (363 kW) is 57,020 CFM. Assuming the additional 5% of heat load, the demand air flow should be adjusted by 5%, bringing the total to 59,871 CFM. The ratio of the adjusted demand air flow to the supply air flow is:
\[ \text{RTI}=\frac{59,871}{87,000}\times 100=69\% \tag{8} \]Consistent with earlier calculations, the RTI also suggests that the data center is overcooled. The degree to which it is overcooled is indicated by the high and low rack cooling indices. An analysis of the CFD results using Eq. (4) and (5) yields:
\[ \text{RCI}_{Hi}=100\% \tag{9} \]and
\[ \text{RCI}_{Lo}<0\% \tag{9} \]A value of 100% for RCIHi means that no racks have inlet temperatures above the recommended maximum value. A value less than 0% for RCILo indicates that the average number of degrees below the recommended minimum value is greater than the number of degrees between the recommended and allowable minimum values. In other words, the inlet temperatures on the whole are much too cold. The metrics calculated for the baseline case are summarized in Table 2.
Estimating the Baseline Data Center Costs
Before considering changes to the data center, the cost of running the facility in its present state is estimated. To determine the cost, the total facility power is needed along with the cost of electricity. Using 746.3kW as the total facility power and $0.09 as the cost per kWh, the estimated annual cost of running the data center is about $588,300, which is within 10% of the actual cost. While this value is not based on the CFD analysis, a similar calculation can be done for proposed modifications to the data center. Thus while a CFD analysis can be used to judge the efficacy of each design, the companion energy calculation can be done to estimate the cost savings.
Modifying the Design
Disabling Zones
As a first step, each of the three active zones is disabled in a series of trials. These trials are solved concurrently on separate nodes at CoolSim’s remote simulation facility (RSF) using the CRAC Failure Analysis model. Trial 1 has Zones 1, 2, and 4 disabled, Trial 2 has Zones 2, 3, and 4 disabled, and Trial 3 has Zones 2, 4, and 5 disabled. For each of these trials, the maximum rack inlet temperature is, at most, 75°F, well below the ASHRAE recommended value of 80.6°F. Trial 1 has the highest rack inlet temperature, and contours for all of the racks for this case are shown in Figure 5.
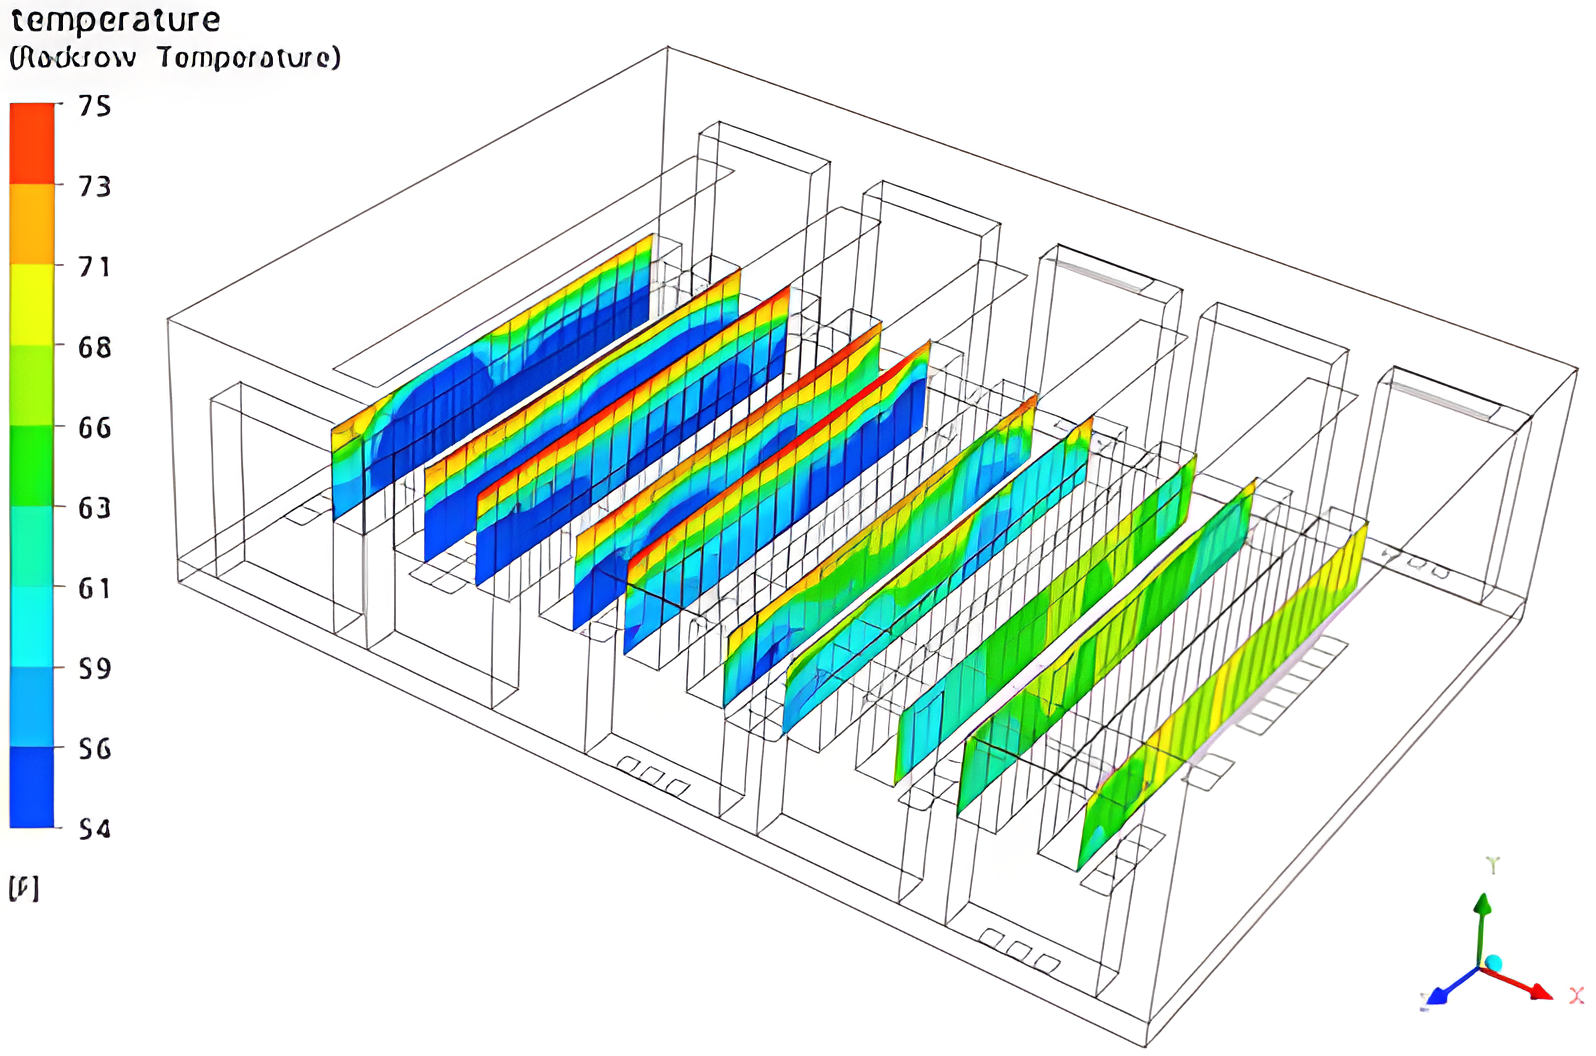
Figure 5
Contours of rack inlet temperature for Trial 1 of the baseline case, where Zones 1, 2, and 4 are shut down
Note that when the left two zones are shut down, the temperature on that side of the room increases. Pathlines of the supply air in the plenum (Figure 6) show that jets from the opposing CRACs collide and deflect the cooling air to the left side of the room, keeping the rack temperatures in range.
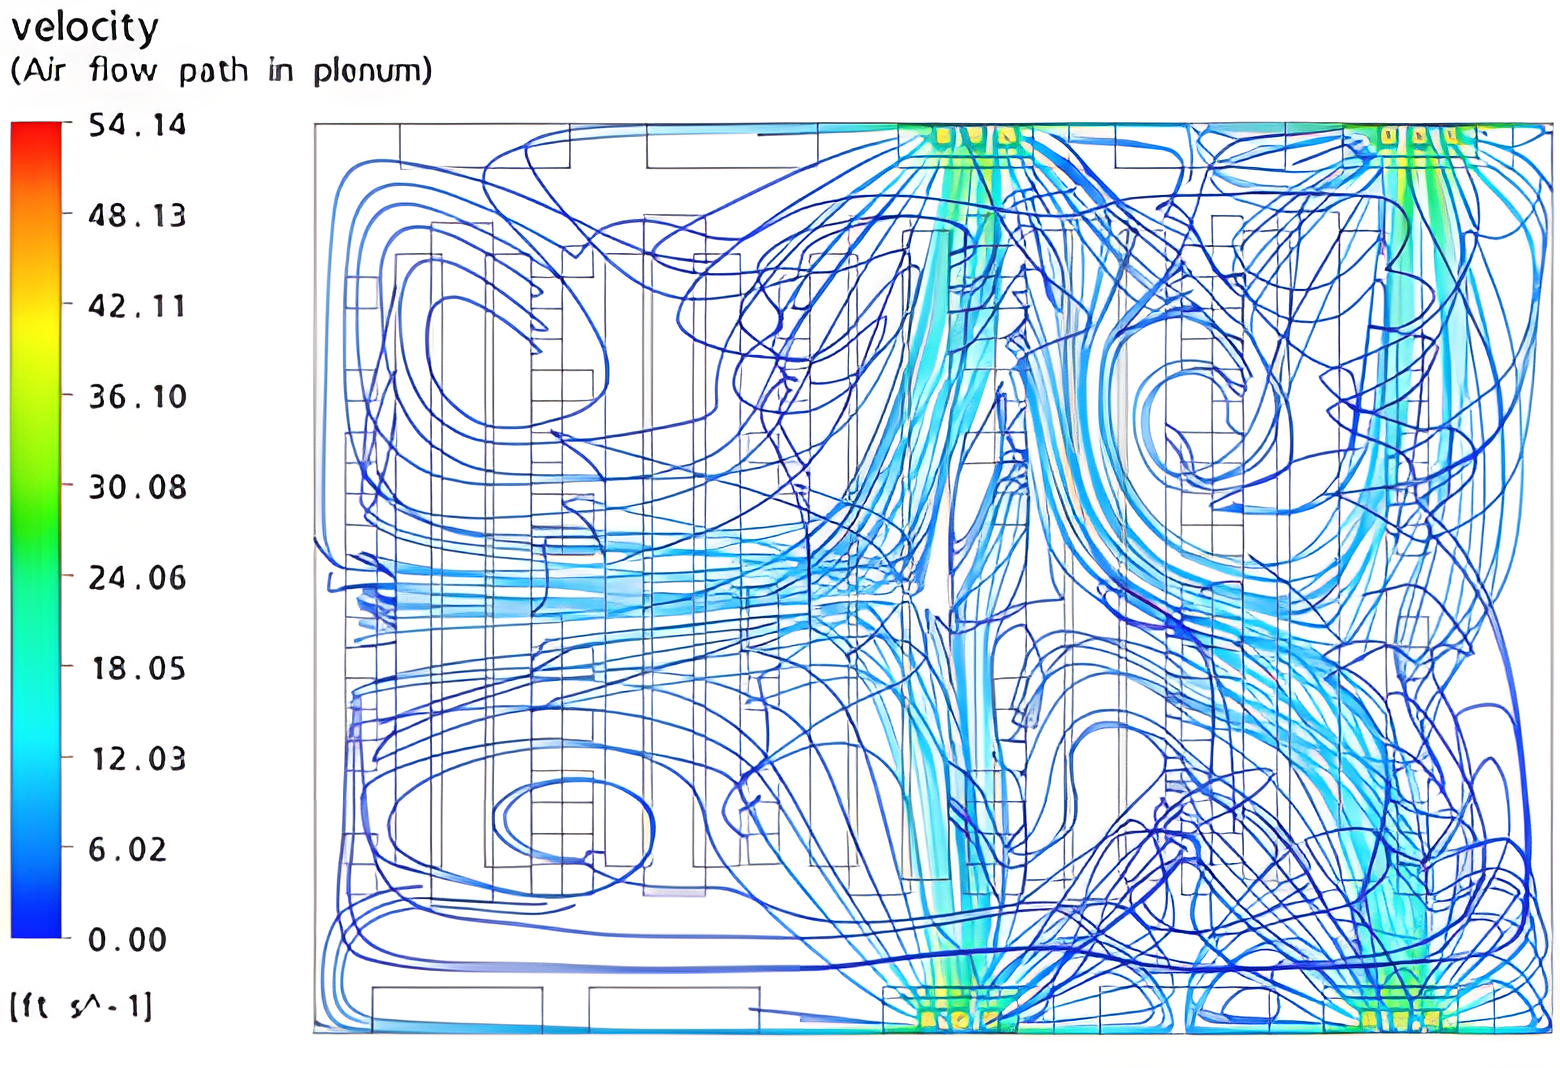
Figure 6
Pathlines of supply air in the plenum for Trial 1 of the baseline case, where Zones 1, 2, and 4 are shut down
These trials illustrate that the simplest modification to the data center—shutting down one of the zones—will not adversely impact the equipment.
The data center metrics computed for Trial 1 show a great deal of improvement in energy efficiency and an associated cost savings. Because the amount of power needed to run the cooling system and CRAC fans is two-thirds of the earlier value, the total cooling power is reduced to 211.4 kW and the COP is increased to 2.3. The total facility power is reduced to 624.6 kW, leading to a decrease in the PUE to 1.64. The return temperature index increases from 69% to 103%. Ideally, the RTI should be below 100%, but because an additional 5% of infrastructure equipment is included in the total heat load, the demand air flow rate is assumed to have a corresponding increase, which may be too much (additional heat from overhead lamps may be lost through the ceiling, for example). The RCIHi index remains at 100%, indicating that there are still no racks with temperatures above the recommended value. The RCILo index remains below 0, but only slightly. Thus while the rack inlet temperatures are not as cold as before, they are still colder than they need to be. Owing to the drop in the total facility power, the cost to run the data center also drops. The new annual cost is estimated to be $492,400, representing a savings of about $95,900. These results are summarized in Table 2.
| Baseline Case Trial 0 | Baseline Case Trial 1 | |
|---|---|---|
| IT Heat Load (kW) | 363 | 363 |
| Total IT Heat Load (kW) | 381.2 | 381.2 |
| CRAC Cooling Power (kW) | 269.1 | 179.4 |
| CRAC Fan Power (kW) | 48 | 32 |
| Total Room Heat Load (kW) | 429.2 | 413.2 |
| Total Cooling Power (kW) | 317.1 | 211.4 |
| Total Facility Power (kW) | 746.3 | 624.6 |
| COP | 1.59 | 2.30 |
| PUE | 1.96 | 1.64 |
| Total Supply Air Flow (CFM) | 87,000 | 58,000 |
| Total Demand Air Flow (CFM) | 59,871 | 59,871 |
| RTI (%) | 69 | 103 |
| RCIHi (%) | 100 | 100 |
| RCILo (%) | <0 | <0 |
| Cost of Electricity ($/kWh) | 0.09 | 0.09 |
| Annual Cost ($) | 588,300 | 492,400 |
| Savings ($) | 95,000 |
Increasing the Supply Temperatures
One of the dominant factors in reducing data center energy consumption is air supply temperature. For every 1.8°F increase in supply air temperature, the efficiency of the heat pump improves by 3.5% (Design Considerations for Datacom Equipment Centers, Atlanta: ASHRAE, 2005). Further, by increasing the supply air temperature, the window of “free cooling” opens, since air-side or water-side economizers can be used on more days of the year. Economizers improve the efficiency of the cooling system by making use of the reservoir of outside air in the heat rejection process. If the temperature difference between the supply air and outside air is reduced, the chillers and condensers in the heat rejection system can be augmented or even replaced by economizers, resulting in huge gains in the COP.
Because the data center is initially over-cooled, it is a prime candidate for increased supply temperature. Thus, as a second modification, all of the supply temperatures are increased to 65°F. Recall that in the original configuration, measured temperatures were used for the CRAC boundary conditions and all but two were below 60°F. Increasing all of the supply temperatures to 65°F should alleviate the problems suggested by the RCILo index and improve the COP, which will save a significant amount of power. To properly assess such a proposed change, a CFD analysis is needed to determine if hot spots will form, impacting the performance at the upper end of the recommended range. Contours of the rack inlet temperatures for Trial 0 of this scenario—with Zones 2 and 4 disabled—are shown in Figure 7.
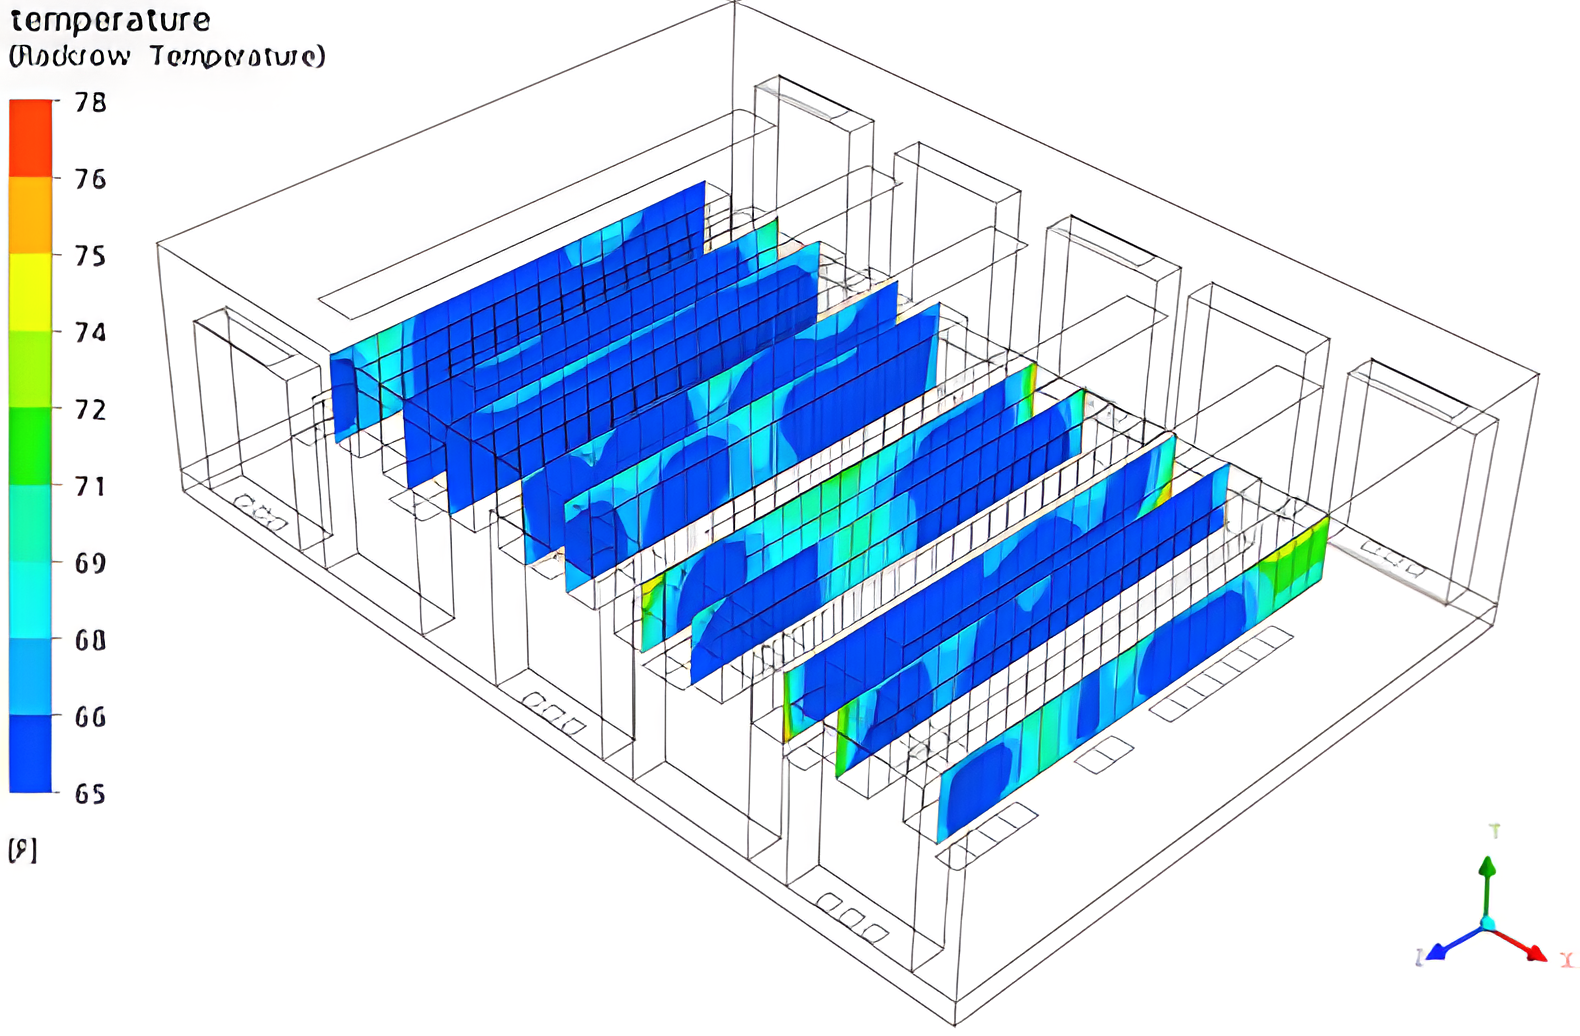
Figure 7
Rack inlet temperatures corresponding to 65°F CRAC supply temperatures for Trial 0 where Zones 2 and 4 are disabled
The minimum and maximum values for the contours are shown in the key on the left. Because the range (65°F to 78°F) falls with the ASHRAE recommended range (64.4°F to 80.6°F), all racks satisfy the condition and the RCIHi and RCILo values are both 100%. The average supply temperature for the baseline case with only two zones disabled is 57°F. Increasing the average supply temperature to 65°F (an 8°F increase) corresponds to a 15% increase in the COP, so the new value for this configuration is 1.84.
The previous analysis showed, however, that disabling an additional zone results in potential savings of about $95,000 a year. Thus a CRAC failure analysis should be done with the 65°F supply temperature boundary condition to make sure that the rack inlet temperatures aren’t too high if one of the zones is disabled. In Figure 8, the rack inlet temperatures are shown for the trial where the maximum rack inlet temperature is highest.
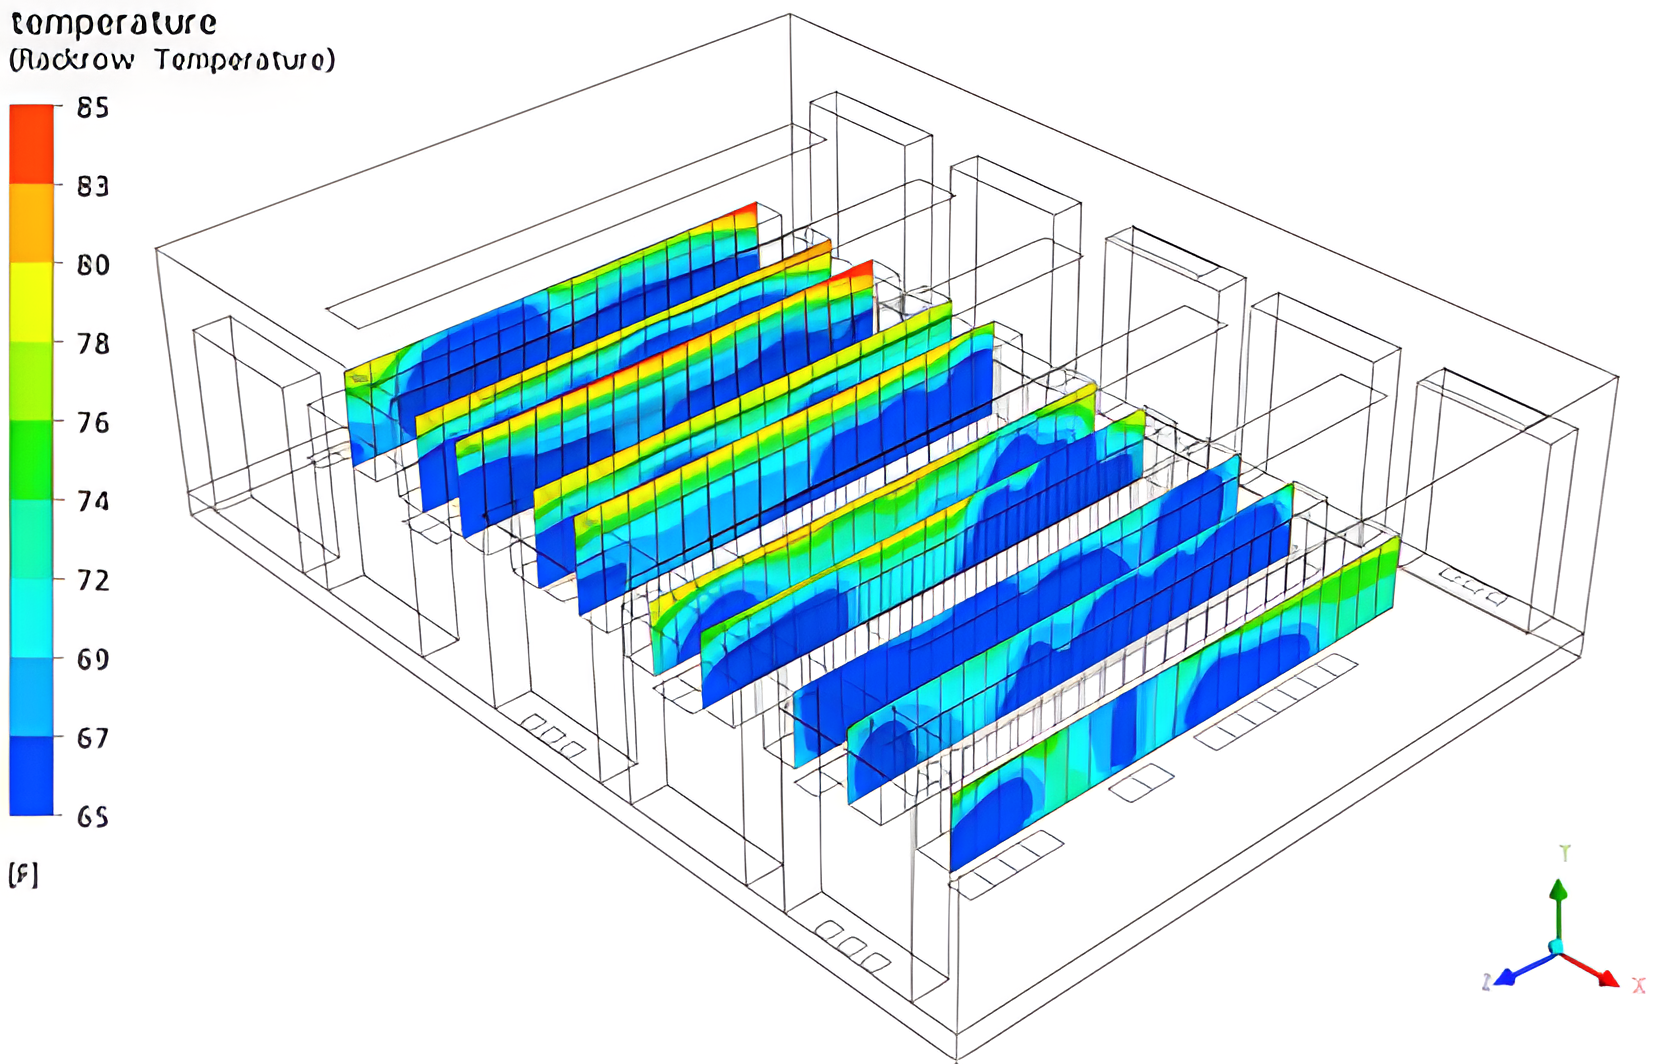
Figure 8
Rack inlet temperatures corresponding to 65°F CRAC supply temperatures for Trial 1 where Zones 1, 2, and 4 are disabled
It is again Trial 1 in which Zones 1, 2, and 4 are disabled. Based on the maximum value shown in the figure, some of the racks have temperatures above the ASHRAE recommended maximum of 80.6°F. A calculation of RCIHi supports this finding, with a value of 97.3%. RCI values between 95% and 100% are considered good for a data center. The value suggests that the average deviation in temperature above the recommended value is small, however, and this is indeed borne out by the detailed results. Indeed, all racks have inlet temperatures that are well below the ASHRAE allowable maximum value (90°F). As expected, RCILo has a value of 100%. With 60°F as the average supply temperature for Trial 1 in the baseline case, the increase in supply temperature for this case (5°F) corresponds to an increase in the COP to 2.53.
Increasing the supply temperatures to 68°F results in RCIHi and RCILo indices of 100% for Trial 0. Furthermore, the COP increases to 1.94. For Trial 1, RCILo remains at 100%, but RCIHi drops to 84%. Even so, none of the rack inlet temperatures go above the ASHRAE allowable value. The COP increases to 2.66 for this scenario.
The total facility power can be computed for each of these cases, and from it, the annual cost of running the data center. A summary of COP values and associated costs for the various trials discussed in this section is presented in Table 3.
| Baseline Trial 0 | Supply 65°F Trial 0 | Supply 68°F Trial 0 | |
|---|---|---|---|
| Average Tsupply | 57 | 65 | 68 |
| COP | 1.59 | 1.84 | 1.94 |
| Total Facility Power (kW) | 746.3 | 710.0 | 699.8 |
| Annual Cost ($) | 588,300 | 559,800 | 551,000 |
| Savings ($) | 28,500 | 37,300 |
| Baseline Trial 1 | Supply 65°F Trial 1 | Supply 68°F Trial 1 | |
|---|---|---|---|
| Average Tsupply | 60 | 65 | 68 |
| COP | 2.3 | 2.53 | 2.66 |
| Total Facility Power (kW) | 624.6 | 608.7 | 600.4 |
| Annual Cost ($) | 492,499 | 479,000 | 473,000 |
| Savings ($) | 12,500 | 19,000 |
Table 3
A comparison of COP and predicted annual costs resulting from increased CRAC supply temperatures; savings of at least $28,000 can be achieved if 3 of the 5 zones are operational (Trial 0, top) and at least $12,000 if one additional zone is disabled (Trial 1, bottom)
Comparison of the Trial 0 results shows that between $28,500 and $37,000 can be saved by increasing the supply temperatures. Comparison of the Trial 1 results shows that an additional $12,500 to $19,000 can be saved by disabling one of the zones. Applying the savings computed in Tables 2 and 3, the annual cost of the data center could be cut by at least $110,000 by disabling one of the zones and increasing the supply temperature to 65°F.
Summary
Computational fluid dynamics and data center metrics have been used to study a data center for which a number of measurements were available. The ten CRACs in the room are controlled using five zones, with two CRACs in each zone. Because the heat load is less than the original planned value, the data center currently operates with only three of the five zones active. Even so, the normal operating configuration is generating temperatures that are colder than needed. CFD was used to test alternative scenarios with additional zones disabled and with increased supply temperatures. For each of the design modifications, energy calculations were performed to estimate the total facility power usage and corresponding cost. The results of the studies show that one additional zone can be disabled and the supply temperatures can be raised slightly. With these changes, the rack inlet temperatures will remain well within the ASHRAE allowable temperature range and the annual cost of running the facility will be reduced by about $100,000.